
What Is a Usage & Attitude Survey and Why Does It Matter

A Usage & Attitude Survey helps businesses understand how customers use products, what they think about brands, and why they make certain buying choices. Learning more about customer behavior can also help businesses understand the reasons behind these decisions.
Sales data can show what customers bought. However, it does not always explain why they bought it. It also does not reveal how they use the product, what they like about it, or why they may choose a competitor next time.
That is where a Usage & Attitude Survey becomes useful.
This type of research combines two kinds of insight. First, it looks at customer actions. Second, it explores customer opinions, needs, preferences, and brand perception.
As a result, businesses can get a fuller picture of the market.
A well-designed study can answer questions such as:
- Who uses the product?
- How often do they use it?
- When and where do they use it?
- Which brands do they know?
- Why do they choose one brand over another?
- What problems do they face?
- What may encourage them to buy more often?
- Which customer groups offer the most potential?
Therefore, a U&A study can support product planning, marketing, brand positioning, and market segmentation for long-term growth.
What Is a Usage & Attitude Survey?
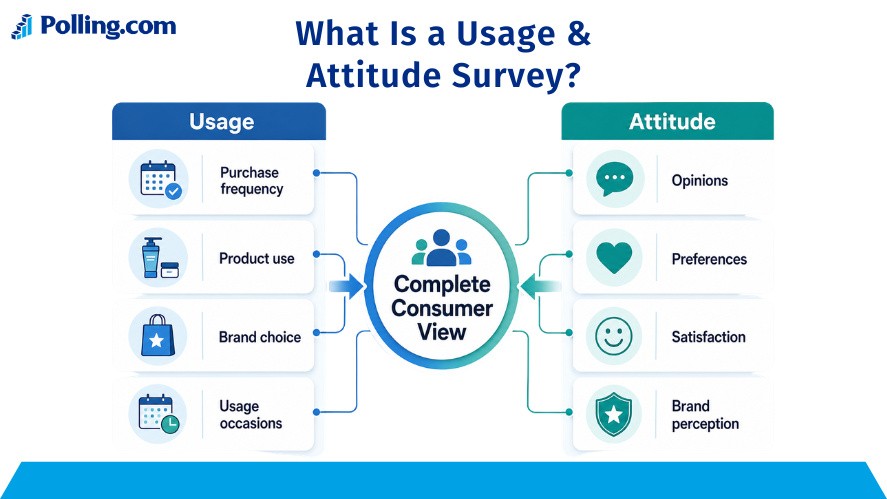
A Usage & Attitude Survey is a market research survey that studies customer behavior and customer opinions.
The “usage” part focuses on what people do. For example, it may measure how often they buy a product, where they buy it, and how they use it.
The “attitude” part focuses on what people think and feel. For instance, it may explore brand trust, satisfaction, preferences, concerns, and purchase motives.
Together, these two areas provide a broader view of the customer.
Definition of a Usage & Attitude Survey
A Usage & Attitude Survey collects information about how consumers behave in a market and how they feel about the brands in that market.
It may also be called a usage and attitude study, an attitude and usage study, or a consumer usage and attitude study.
Although the names differ, the goal is the same. The research aims to show what customers do and why they do it.
For example, a coffee company may already know how often customers buy coffee. However, a U&A study can reveal much more.
It can show:
- Whether customers also buy competing brands
- Which coffee types they prefer
- When they drink coffee
- Where they usually buy it
- Whether price, taste, or convenience matters most
- Why they may switch brands
- What would make them buy more often
Therefore, the study explains the story behind the sales data.
How U&A Surveys Differ from Other Market Research Surveys
Many surveys focus on one narrow topic.
For example, a customer satisfaction survey looks at a recent experience. A brand awareness survey measures whether people know a brand. A product feedback survey gathers opinions about a product or feature.
A U&A survey is broader.
It may cover:
- Category use
- Product usage
- Brand awareness
- Brand consideration
- Purchase frequency
- Usage frequency
- Purchase channels
- Brand attitudes
- Satisfaction
- Loyalty
- Switching behavior
- Competitor use
- Unmet needs
Because of this wider focus, Usage and Attitude market research is useful for major business decisions.
Why Conduct a Usage & Attitude Survey?
Businesses run U&A studies because they need more than basic sales numbers.
A sales report may show that revenue is falling. However, it may not explain why. A Usage & Attitude Survey can help uncover the reason.
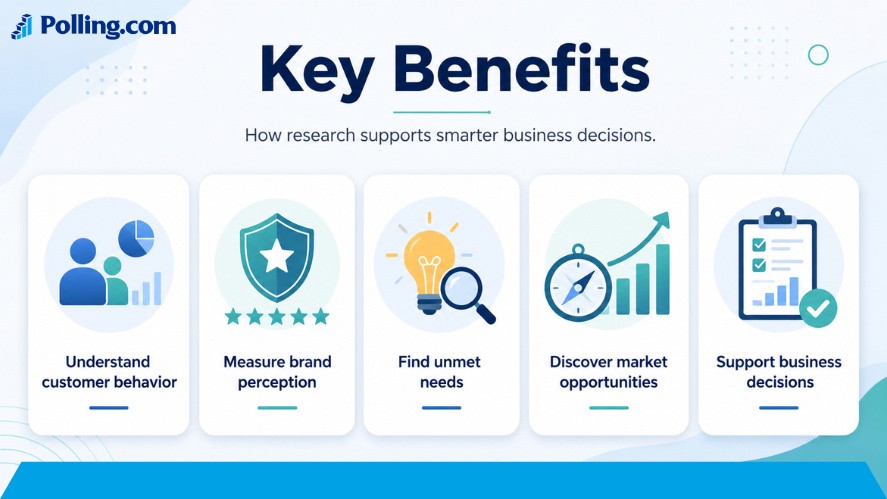
For example, customers may think the product is too expensive. They may find it hard to use. They may also believe that a competitor offers better value.
Once the business understands the cause, it can respond with a stronger plan.
Understand Consumer Behavior Through a Usage & Attitude Survey
One of the main goals of a Usage & Attitude Survey is understanding customer behavior.
Many businesses ask, what is customer behavior?
Customer behavior includes the actions and choices people make before, during, and after a purchase. It covers how they discover products, compare options, buy, use, review, and replace them.
A U&A survey can explore:
- Purchase frequency
- Usage frequency
- Brand switching
- Buying channels
- Product preferences
- Purchase triggers
- Decision makers
- Barriers to purchase
- Reasons for repeat use
This information supports better customer behavior analysis.
Here is a simple customer behavior analysis example.
A skincare company may find that younger customers discover products on social media. Meanwhile, older customers may rely on pharmacists, reviews, or expert advice.
As a result, the company should not use the same marketing message for both groups. Instead, it can adjust its content, sales channels, and product education.
Measure Consumer Attitudes
Behavior shows what customers do. However, attitudes explain why they do it.
A Usage & Attitude Survey can measure:
- Trust
- Satisfaction
- Perceived quality
- Value for money
- Brand image
- Emotional connection
- Product concerns
- Feature preferences
- Reasons for rejection
For example, customers may like a product but still believe it costs too much. In another case, they may trust the brand but find the buying process difficult.
These details matter because each problem needs a different solution.
Identify Market Opportunities
A U&A study can also reveal gaps in the market.
For example, customers may want a smaller package, a lower-cost option, or an easier way to buy. They may also need a feature that no brand currently offers.
Possible opportunities include:
- A new customer segment
- A new product size
- A new usage occasion
- A better sales channel
- Improved product education
- A more affordable option
- A stronger service model
- Greater market penetration
The research can also support market sizing.
For instance, businesses can estimate how many people use the category, how often they buy, and which groups show the strongest demand.
However, survey data should not stand alone. It is better to combine it with sales data, industry reports, and population data.
Common Objectives of a Usage & Attitude Survey
Before creating the survey, the business should define its main goal.
A broad goal such as “learn more about customers” is not enough. Instead, the team should decide what business question it needs to answer.
Learn Who Uses Your Product
A company needs to know who uses its product and who does not.
The survey may collect details such as:
- Age
- Income
- Location
- Household size
- Job role
- Lifestyle
- Needs
- Experience level
- Buying power
However, demographics are only one part of the picture.
Two people of the same age may have very different habits. Therefore, businesses should also look at needs, attitudes, and behavior.
For example, a fitness app may have several user groups:
- Daily users
- Weekend users
- New users
- Former users
- Interested nonusers
Each group may need a different message or product experience.
Discover How Customers Use It
Understanding product usage can help improve the product and the way it is marketed.
The survey may ask:
- How often do you use the product?
- Where do you use it?
- When do you use it?
- Which features do you use?
- Which features do you ignore?
- Who uses it with you?
- What other products do you use at the same time?
Sometimes, customers use a product in ways the company did not expect.
When this happens, the business may discover a new use case or a new market.
Understand Why Customers Choose Your Brand
Customers often choose a brand for several reasons.
Price may matter. However, convenience, trust, quality, habit, and social influence may also play a role.
A survey can measure the factors behind purchase behavior, such as:
- Price
- Quality
- Reputation
- Ease of use
- Availability
- Customer service
- Design
- Recommendations
- Reliability
- Sustainability
This helps the business understand which factors have the strongest effect on the buying decision.
Analyze Competitor Usage
Customers do not view a brand by itself. They compare it with other choices.
Therefore, a U&A survey should include questions about competitors.
It can measure:
- Which brands customers know
- Which brands they have used
- Which brand they use most
- Which brand they prefer
- Why they switch
- Which brand they trust
- Which brand offers the best value
This gives the company a clearer view of its market position.
Measure Brand Loyalty
Repeat buying does not always mean true loyalty.
A customer may keep buying because the product is easy to find. Another may stay because there are no better options.
Therefore, the survey should look at deeper signs of loyalty.
These may include:
- Intent to buy again
- Willingness to recommend
- Trust in the brand
- Emotional preference
- Resistance to competitor offers
- Willingness to pay more
- Likelihood of switching
As a result, the company can see which customers are loyal and which are at risk.
Identify Customer Pain Points
Pain points can appear at any stage of the customer journey.
Common examples include:
- Confusing product details
- Difficult setup
- Poor service
- High prices
- Limited stock
- Missing features
- Delivery problems
- Hidden costs
- Hard return processes
Once the business finds these problems, it can decide which ones to fix first.
When Should You Run a Usage & Attitude Survey?
Many companies ask When to perform a U&A study.
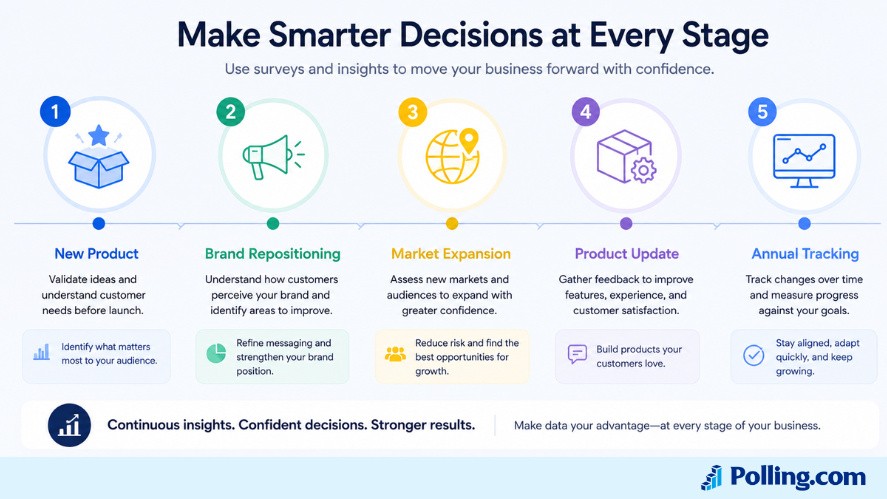
The best time depends on the decision the business needs to make.
Before Launching a New Product
A U&A study can help test demand before a company invests too much time and money.
It can show:
- Whether the need is real
- How customers solve the problem today
- Which features matter most
- What price seems fair
- Which groups show the most interest
- What may stop people from buying
- Which competitors already serve the market
Therefore, the research can reduce launch risk.
During Brand Repositioning
A brand may want to appear more modern, trusted, affordable, or premium.
However, before changing its message, it should understand how customers see it now.
A U&A survey can compare:
- Current brand image
- Desired brand image
- Customer expectations
- Competitor positions
- Key purchase drivers
This helps the business create a more believable brand position.
Before Expanding Into New Markets
Customer needs can change across regions, age groups, and income levels.
A product that works well in one market may not succeed in another.
Therefore, a U&A study can examine:
- Local customer needs
- Category use
- Competitor strength
- Price sensitivity
- Sales channels
- Barriers to adoption
- Brand awareness
This can guide a smarter market entry plan.
After Major Product Updates
A product update may improve the experience. However, it may also create new problems.
After the update, a survey can measure:
- Awareness of the changes
- Use of new features
- Ease of use
- Satisfaction
- Remaining pain points
- Purchase or renewal intent
In addition, the study may show that customers are unaware of the new features. In that case, the main issue may be communication rather than product design.
Annual Market Health Tracking
Markets change over time.
New competitors enter. Customer needs change. Prices rise. New technology also changes expectations.
Therefore, regular research can track:
- Category use
- Brand awareness
- Brand usage
- Customer attitudes
- Satisfaction
- Loyalty
- Switching
- New needs
For clear comparisons, core questions should remain the same over time.
Types of Usage and Attitude Studies
The Types of Usage and Attitude studies depend on the research goal.
Category-Level Studies
These studies examine the whole market.
They help businesses understand category use, common needs, major brands, and customer habits.
Brand-Focused Studies
These studies look closely at one brand.
They often measure brand use, brand image, satisfaction, loyalty, and competitor differences.
Product-Focused Studies
These studies focus on one product or service.
They may explore feature use, satisfaction, use cases, and improvement needs.
Segmentation Studies
Segmentation studies group customers based on shared traits.
These traits may include behavior, needs, attitudes, or purchase habits.
The final segments can support better targeting and product planning.
Tracking Studies
Tracking studies repeat the same core measures over time.
As a result, businesses can spot changes in behavior, awareness, and brand health.
Innovation Studies
Innovation studies look for unmet needs and weak points in current solutions.
The findings can guide new products, features, packaging, or services.
Key Questions to Include in a Usage & Attitude Survey
Strong survey questions should link directly to the research goal.
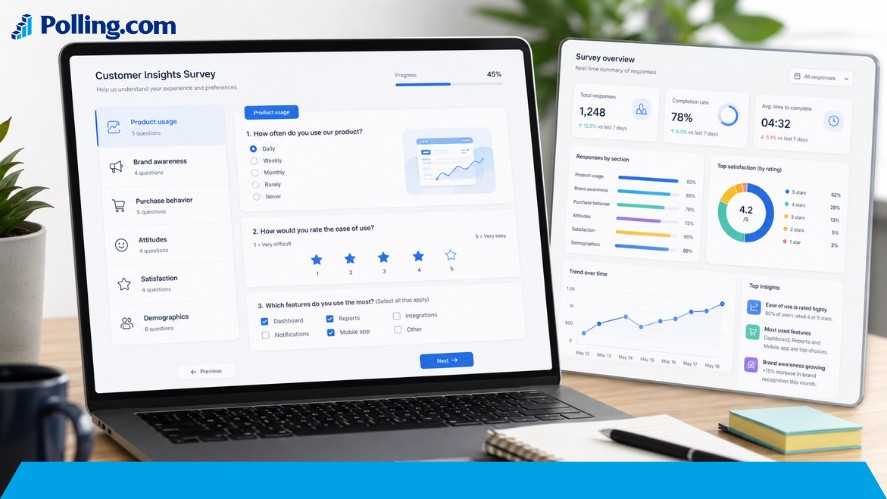
Every question should help the business make a decision.
Product Usage Questions in a Usage & Attitude Survey
Useful questions include:
- Which products have you used in the past six months?
- How often do you use this product?
- When did you last use it?
- Where do you usually use it?
- Which features do you use most?
- Which features do you use least?
- Which other products do you use for the same need?
These questions help build a clear picture of behavior.
Brand Awareness Questions
Brand awareness questions measure which brands people know.
Unaided awareness asks people to name brands without seeing a list.
Aided awareness shows a list and asks which brands they recognize.
Examples include:
- Which brands come to mind in this category?
- Which of these brands have you heard of?
- Which brands have you considered?
- Which brands have you bought?
- Which brand do you use most often?
Unaided questions should come first. Otherwise, the brand list may affect recall.
Purchase Behavior Questions
These questions explore how customers make buying decisions.
Examples include:
- How often do you buy this product?
- Where do you buy it?
- How much do you usually spend?
- Who makes the final decision?
- Which factors matter most?
- What caused your last purchase?
- Have you switched brands in the past year?
These answers can reveal the full purchase journey.
Attitudinal Questions
Attitudinal questions explore beliefs and feelings.
For example, respondents may rate statements such as:
- This brand is trustworthy.
- This product is easy to use.
- This brand offers good value.
- This brand understands my needs.
- I would recommend this brand.
Each statement should focus on one idea.
For example, “This product is affordable and reliable” asks about two things. Therefore, it should be split into two statements.
Satisfaction Questions
Satisfaction questions can focus on the full experience or one part of it.
Examples include:
- How satisfied are you overall?
- How satisfied are you with product quality?
- How satisfied are you with delivery?
- How satisfied are you with customer service?
- What should we improve first?
When creating surveys for customers, the questions should be clear and useful.
Businesses should also follow best practices for customer satisfaction surveys. For example, they should use simple scales, ask about recent experiences, and keep the survey focused.
Demographic Questions
Demographic questions help businesses compare groups.
They may include:
- Age
- Gender
- Region
- Income
- Education
- Job role
- Household size
However, only ask for information that supports the research.
Too many personal questions may make people leave the survey.
Questions to Ask for Surveys
When choosing questions to ask for surveys, focus on three goals:
- Find the right respondents.
- Measure the main research question.
- Compare useful customer groups.
Good survey questions for customers may cover needs, use, satisfaction, preferences, barriers, and future plans.
Usage and Attitude Study Methodology
A strong Usage and Attitude study methodology includes more than survey writing.
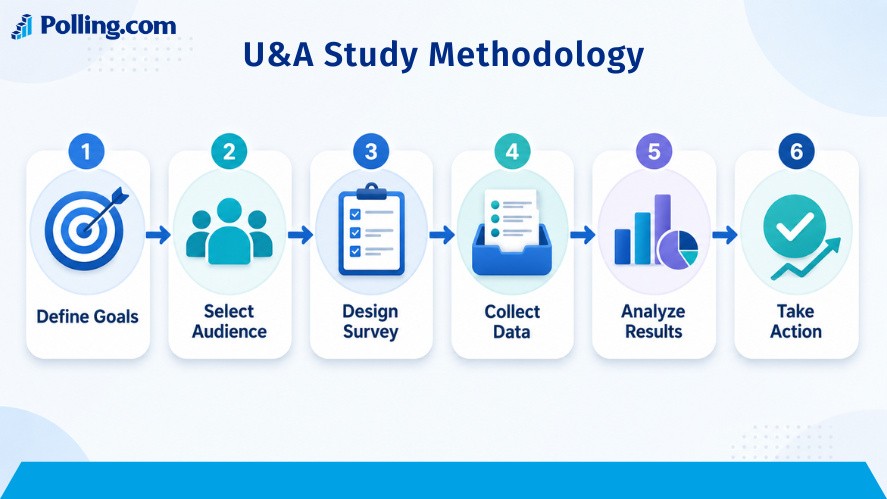
It also includes sampling, testing, data quality, analysis, and reporting.
Define the Business Problem
Start with the decision the business needs to make.
For example:
- Why are customers switching?
- Which group should we target?
- Is there demand for a new product?
- How do customers see our brand?
- What stops people from buying more often?
A clear question leads to a better survey.
Define the Target Audience
The audience may include:
- Current customers
- Former customers
- Competitor customers
- Category users
- Nonusers
- Decision makers
- Prospects
The team should also set clear rules for who can take part.
Choose the Sample
The sample should represent the audience the business wants to understand.
Common options include:
- Random sampling
- Quota sampling
- Customer list sampling
- Research panels
- Intercept sampling
The best choice depends on the goal, budget, and target market.
Decide on Sample Size
There is no single correct sample size for every study.
The number depends on:
- Audience size
- Margin of error
- Confidence level
- Number of segments
- Budget
- Type of analysis
A sample may be large enough for the total market but too small for detailed subgroup analysis.
Choose the Survey Method
U&A studies can use:
- Online surveys
- Phone interviews
- In-person interviews
- Mobile surveys
- Mixed methods
Online surveys are often fast and affordable. However, the method should fit the audience.
Add Quality Checks
Data quality checks may include:
- Attention checks
- Duplicate detection
- Speed checks
- Logic checks
- Review of open answers
- Removal of ineligible responses
These steps help protect the results.
How to Design an Effective Usage & Attitude Survey
Good survey design makes the results more accurate and easier to use.
Define Clear Research Objectives
Before writing questions, list:
- The business problem
- The target audience
- The main metrics
- The key comparisons
- The final decision
Then, remove any question that does not support those goals.
Target the Right Audience
Use screening questions to confirm that respondents are relevant.
For example, ask about:
- Recent category use
- Purchase role
- Location
- Experience
- Customer status
This helps prevent poor-quality data.
Keep Questions Neutral
Leading questions can push people toward an answer.
For example:
“How satisfied are you with our easy-to-use platform?”
This assumes the platform is easy to use.
A better version is:
“How easy or difficult is the platform to use?”
The second version is more neutral.
Mix Closed and Open-Ended Questions
Closed questions are easy to count and compare.
Open-ended questions allow people to explain their views.
Therefore, a strong survey often uses both.
However, too many open-ended questions can make the survey feel like work. Use them only when deeper detail is needed.
Use a Logical Flow
A clear survey may follow this order:
- Introduction
- Screening
- Category use
- Brand awareness
- Brand use
- Purchase behavior
- Attitudes
- Satisfaction
- Future intent
- Demographics
This flow feels natural and helps people stay engaged.
Pilot Test Before Launch
Always test the survey with a small group first.
A pilot test can find:
- Confusing questions
- Missing answers
- Broken logic
- Technical errors
- Long sections
- Unclear scales
Fixing these issues early can save time and money.
Best Practices for Running a Usage & Attitude Survey
A good survey also needs strong execution.
Keep Surveys Concise
Long surveys lead to poor attention and more dropouts.
Therefore, remove repeated or low-value questions.
A shorter survey often gives better data than a longer one.
Avoid Leading Questions
Do not use sales language or emotional wording.
Also avoid questions that assume a certain answer.
Instead, use simple and balanced language.
Use Consistent Rating Scales
Keep scale direction and labels the same.
For example, do not use 1 as “very poor” in one question and “excellent” in another.
Consistency reduces errors.
Segment Results by Audience
Averages can hide important differences.
Therefore, compare results by:
- Age
- Region
- Brand used
- Usage level
- Customer status
- Purchase channel
- Satisfaction level
For example, overall satisfaction may look stable. However, satisfaction among high-value customers may be falling.
Combine Quantitative and Qualitative Insights
Numbers show what is happening.
Open comments and interviews help explain why.
Therefore, businesses may combine survey data with:
- Interviews
- Reviews
- Support tickets
- Sales data
- Website data
- Focus groups
This gives a stronger view of the customer.
Choose the Right Customer Feedback Tools
Different customer feedback tools serve different needs.
Some feedback tools are best for simple satisfaction checks. Other survey tools support complex research.
Useful features may include:
- Skip logic
- Randomization
- Mobile design
- Branding
- Data export
- Real-time reporting
- Response checks
The tool should fit the study.
How to Analyze Usage & Attitude Survey Results
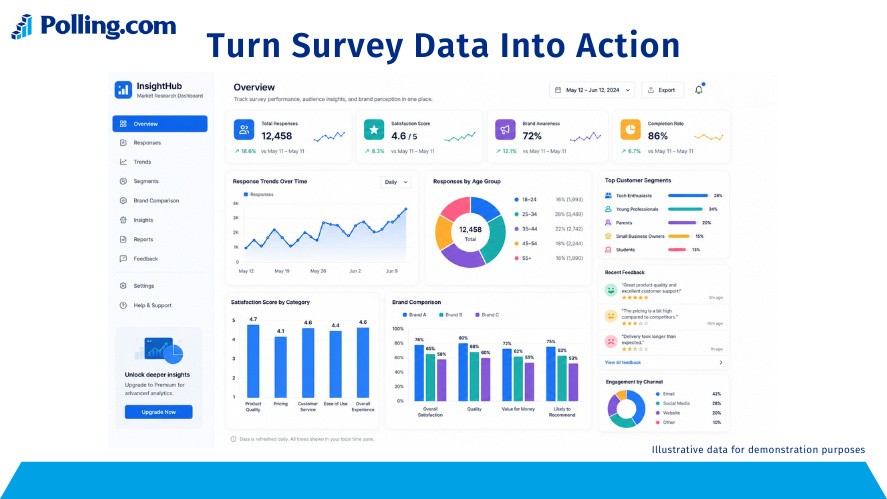
The survey is only useful when the business turns data into action.
Clean the Data
First, review the responses.
Look for:
- Incomplete surveys
- Duplicate responses
- Very fast answers
- Inconsistent answers
- Poor open-text responses
- Ineligible respondents
Remove weak data when needed.
Identify Usage Patterns
Next, review the main behavior trends.
For example:
- How often do people buy?
- Which brands do they use?
- Where do they shop?
- When do they use the product?
- Which features matter most?
- Why do they switch?
These patterns can show where the biggest opportunities exist.
Compare Customer Segments
Now compare groups.
Ask:
- Which group buys most often?
- Which group is most satisfied?
- Which group is most likely to switch?
- Which group has the highest growth potential?
- Which group knows the brand least?
This makes the results more useful.
Measure Brand Perception
Compare the brand with competitors across key traits.
These may include:
- Trust
- Quality
- Price
- Ease of use
- Innovation
- Customer service
- Sustainability
This can show where the brand is strong and where it needs work.
Conduct Customer Behavior Data Analysis
Strong customer behavior data analysis looks at more than one number.
For example, businesses may compare:
- Awareness and purchase
- Trial and repeat use
- Frequency and satisfaction
- Usage and loyalty
- Purchase triggers and barriers
Learning how to analyze customer behavior means linking behavior with attitudes.
This makes customer behavior analysis more useful for decision-making.
Spot Emerging Trends
Look for changes in:
- Price sensitivity
- Channel use
- Product needs
- Brand trust
- Usage occasions
- Competitor choice
- Interest in convenience
However, one survey does not always prove a long-term trend.
For stronger evidence, repeat key questions over time.
Turn Insights Into Action
Every major finding should lead to a next step.
For example:
Finding: New users find setup difficult.
Meaning: Setup problems may reduce repeat use.
Action: Create a simpler onboarding process.
Measure: Track activation and repeat use.
This turns research into business value.
Benefits of Using Polling.com for Usage & Attitude Surveys
Polling.com can help businesses create, share, and review surveys in one place.
Before starting, confirm that the plan includes the features needed for the study.
Fast Survey Creation
A simple survey builder can make setup faster.
Templates may also help. However, the survey should still match the business goal.
Advanced Survey Logic
Survey logic can show different questions to different people.
For example:
- Competitor users can answer competitor questions.
- Nonusers can explain why they do not buy.
- Frequent users can answer detailed usage questions.
- Former customers can explain why they left.
This keeps the survey more relevant.
Unlimited Surveys and Responses
Plans with unlimited surveys or responses may help teams run larger studies.
However, always review the current plan terms and limits.
Real-Time Analytics
Real-time results can help teams track responses during the study.
They can also help spot problems, such as high drop-off at one question.
Still, the team should complete data checks before making final decisions.
Easy Customization and Branding
Branding can improve trust and create a more consistent experience.
Options may include:
- Logos
- Colors
- Fonts
- Welcome messages
- Thank-you pages
However, too much branding may influence answers in brand comparison research.
Flexible Distribution Options
Businesses may share surveys through:
- Websites
- Social media
- QR codes
- Direct links
- Customer groups
The best channel depends on the audience.
Common Mistakes to Avoid
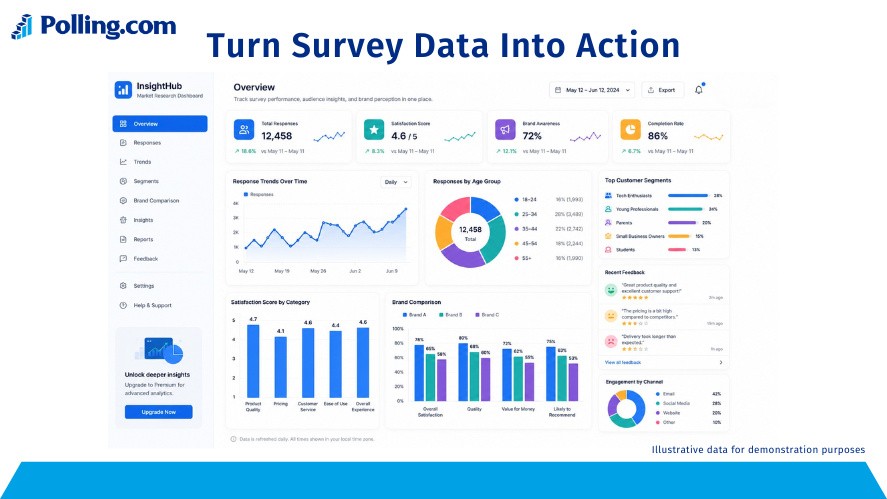
Several mistakes can weaken a U&A study.
Asking Too Many Questions
Long surveys reduce focus.
Therefore, include only the questions needed to meet the research goal.
Surveying the Wrong Audience
Poor targeting creates poor results.
Use clear screening rules and a suitable sample.
Ignoring Competitors
Customers compare brands.
Therefore, include questions about competitor use, preference, and switching.
Skipping Pilot Testing
A small test can catch major problems.
Do not launch the full survey before checking the flow, wording, and logic.
Using Weak Answer Options
Answer choices should be clear and complete.
Add “other,” “none,” or “not sure” when needed.
Treating Correlation as Causation
Two results may be linked without one causing the other.
For example, loyal customers may be more satisfied. However, the survey may not prove which came first.
Failing to Act on Insights
Research should lead to action.
Assign owners, set priorities, and measure results.
Frequently Asked Questions
It measures how customers behave and how they feel about a product, brand, or market.
It helps businesses understand usage, needs, attitudes, loyalty, and purchase decisions.
It should be long enough to answer the main research question but short enough to keep people engaged.
In general, focus on essential questions and test the survey before launch.
The right sample size depends on the audience, budget, number of segments, and required level of accuracy.
There is no single answer for every study.
Many industries can use them, including:
Retail
Technology
Healthcare
Finance
Travel
Education
Consumer goods
Business services
The timing depends on the market.
Fast-changing markets may need more frequent studies. Stable markets may need them less often.
Businesses may also run one before a launch, expansion, or brand change.
No.
A U&A survey is useful, but it works best with other market research methods.
These may include interviews, sales data, web data, reviews, and focus groups.
Purchase frequency measures how often customers buy.
Usage frequency measures how often they use the product.
For example, a person may buy once a month but use the product every day.
Purchase frequency measures how often customers buy.
Usage frequency measures how often they use the product.
For example, a person may buy once a month but use the product every day.
Conclusion
A Usage & Attitude Survey helps businesses understand what customers do and why they do it.
It can reveal who uses a product, how they use it, which brands they prefer, and what may cause them to switch.
As a result, the business can make better decisions about products, marketing, customer experience, and growth.
The best studies start with a clear goal. They also use the right audience, simple questions, logical survey flow, and strong data checks.
Most importantly, the results should lead to action.
Polling.com can help teams create, share, and review surveys in one place. However, the survey design still needs to support the business goal.
When planned well, a Usage & Attitude Survey becomes more than a research project. It becomes a useful guide for better decisions and a stronger business growth strategy.