

Market Sizing Explained with Examples and Proven Methods

Market Sizing helps businesses estimate how much demand exists for a product, service, or business idea before they invest heavily in development, hiring, marketing, or expansion.
A promising idea can still fail when the available market is too small, too competitive, or too difficult to reach. On the other hand, a company may underestimate an opportunity because it relies on assumptions instead of evidence. For that reason, market sizing is a critical part of strategic planning.
At its core, the process helps answer several practical questions. How many potential customers exist? How much do they spend? Which portion of the market can the company serve? Most importantly, how much revenue could the business realistically capture?
Although industry reports provide useful starting points, they rarely tell the full story. Customer preferences, purchase frequency, price sensitivity, and willingness to switch can significantly affect the final estimate. Therefore, reliable estimates usually combine secondary data with surveys, interviews, competitor research, and internal sales information.
This guide explains what market sizing is, why it matters, how TAM, SAM, and SOM work, and when to use top-down or bottom-up methods. In addition, it shows how surveys can improve accuracy and includes practical examples for a SaaS startup, a restaurant chain, and an ecommerce business.
What Is Market Sizing?
To define market sizing, it is the process of estimating the total potential demand, customer volume, or revenue available within a specific market.
Depending on the business model, market size may be measured by:
- Number of customers
- Number of companies
- Annual revenue
- Units sold
- Subscription volume
- Number of transactions
- Geographic demand
For example, suppose a company sells accounting software to small businesses. If 500,000 companies fit the target profile and the software costs $600 per year, the broad market opportunity would be:
500,000 businesses × $600 = $300 million per year
However, that figure does not mean the company can earn $300 million. Some businesses may already use competing software, while others may not have the budget or need for the product. Furthermore, the company may serve only certain industries or regions.
Consequently, a complete analysis narrows the opportunity from a broad market to a realistic revenue target.
Market Sizing vs. Market Research
Although market sizing and market research are closely related, they are not identical.
Market sizing focuses on scale. It estimates the number of potential customers, the amount they spend, and the total value of the opportunity.
Market research, by comparison, examines customer needs, preferences, behaviors, competitors, pricing, industry trends, and purchasing decisions.
In simple terms, market sizing tells you how large the opportunity may be. Market research explains why that opportunity exists and whether customers are likely to respond to a particular offer.
For instance, an industry report may suggest that a software category is worth $1 billion annually. Nevertheless, customer interviews could reveal that most buyers are satisfied with their existing tools. As a result, the obtainable opportunity may be far smaller than the industry figure suggests.
Common Uses of Market Sizing
Startups commonly use market estimates to validate ideas, support pitch decks, and prepare revenue forecasts. Meanwhile, established companies may use them to assess new products, customer segments, or geographic markets.
Investors also examine market size when evaluating potential returns. A business with a limited market may struggle to achieve large-scale growth, even if its product is excellent.
Common applications include:
- New product launches
- Geographic expansion
- Investor presentations
- Pricing decisions
- Sales forecasting
- Acquisition analysis
- Customer segmentation
- Resource allocation
- Competitive planning
Ultimately, the purpose is not to create the largest possible number. Instead, the goal is to make a stronger business strategy based on realistic evidence.
Why Market Sizing Is Important
An accurate estimate helps companies compare opportunities before spending significant time or capital. Moreover, it exposes assumptions that might otherwise remain hidden.
Market Sizing Helps Validate Business Opportunities
A product may solve a real problem without becoming a profitable business. Perhaps too few customers experience the problem. Alternatively, customers may recognize the need but remain unwilling to pay.
Market sizing forces teams to examine those possibilities.
Suppose an entrepreneur wants to launch a premium meal-planning service. Initially, millions of health-conscious consumers may appear to represent a large market. Yet research may show that only a small percentage pay for personalized plans.
That finding does not automatically mean the idea should be abandoned. Instead, the company might narrow its target market, adjust the pricing, change the offer, or focus on a higher-value segment.
Market Sizing Helps Attract Investors
Investors generally want more than a statement such as, “This industry is worth billions.”
A credible market estimate should explain:
- How many customers exist
- How much those customers spend
- Which regions are included
- What assumptions were used
- Which competitors already serve the market
- What adoption rate is realistic
- How the company plans to acquire customers
Because investors understand that startups cannot capture an entire industry, a transparent model is often more persuasive than an inflated projection.
Market Sizing Helps Prioritize Customer Segments
Many businesses serve several customer groups. However, each group may have different spending levels, acquisition costs, sales cycles, and retention rates.
For example, a cybersecurity company might target freelancers, small businesses, mid-sized companies, and enterprises. Large companies may offer higher contract values, but they often require longer sales cycles and more support.
Therefore, the company should estimate each segment separately. Doing so clarifies which opportunity offers the best balance between revenue potential and cost.
It also helps distinguish a target market and audience. The target market represents the commercial opportunity, whereas the audience consists of the specific people the company wants to reach through marketing and sales.
Market Sizing Improves Product and Marketing Decisions
Reliable estimates can also influence product development.
If most potential customers want a simple, affordable solution, the company may avoid building advanced features that few users value. Conversely, a premium segment may require stronger security, customization, customer support, or integration capabilities.
Marketing decisions improve as well. Teams can identify which regions, customer groups, and messages deserve priority. In turn, budgets become easier to allocate because the company understands where meaningful demand is most likely to exist.
The Three Core Market Sizing Metrics
Most market estimates rely on three core metrics: Total Addressable Market, Serviceable Available Market, and Serviceable Obtainable Market.
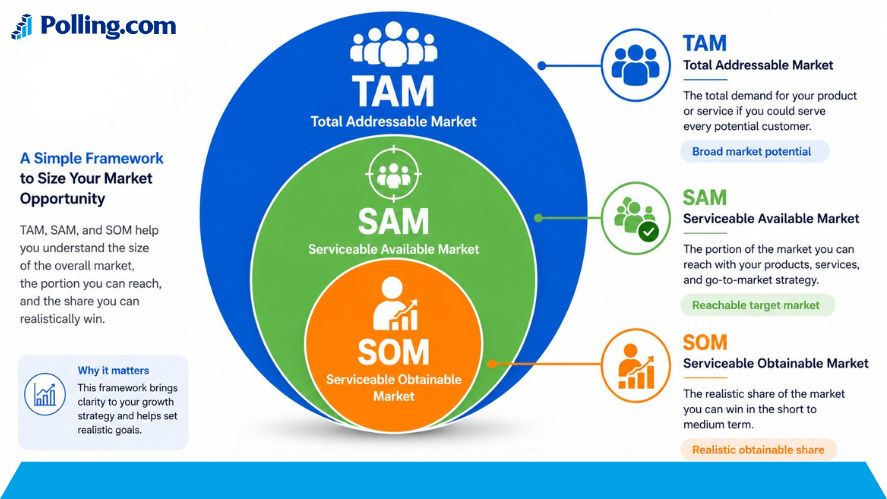
Together, they narrow the opportunity from the broadest possible market to a realistic revenue target.
Market Sizing Metric 1: Total Addressable Market
Total Addressable Market, or TAM, represents the total potential demand for a product or service if one company could serve every relevant customer.
TAM is useful for understanding overall scale. Even so, it should not be treated as a sales forecast.
Suppose a company sells scheduling software to dental clinics. Assume 200,000 clinics fit the broad customer definition, and the annual subscription price is $2,400.
The calculation would be:
200,000 clinics × $2,400 = $480 million per year
Therefore, the TAM is $480 million.
However, the company may not operate in every country, support every language, or meet every regulatory requirement. Because of those limitations, the next step is to calculate SAM.
Market Sizing Metric 2: Serviceable Available Market
Serviceable Available Market, or SAM, represents the portion of TAM the company can actually serve based on its location, product capabilities, pricing, and business model.
Continuing the dental software example, suppose the company initially sells only in the United States and Canada. Within those regions, 55,000 clinics match the product requirements.
The calculation becomes:
55,000 clinics × $2,400 = $132 million per year
As a result, the SAM is $132 million.
This figure is more useful than TAM because it reflects the company’s current reach. Still, it does not account for competition, sales capacity, or customer resistance.
Market Sizing Metric 3: Serviceable Obtainable Market
Serviceable Obtainable Market, or SOM, represents the portion of SAM that the business can realistically capture within a defined period.
Assume the dental software company expects to acquire 1,500 clinics during its first three years.
The calculation would be:
1,500 clinics × $2,400 = $3.6 million per year
Accordingly, the company’s SOM is $3.6 million.
A credible SOM estimate should consider:
- Sales team capacity
- Marketing budget
- Customer acquisition cost
- Competitor strength
- Conversion rates
- Implementation capacity
- Customer churn
- Brand awareness
- Market penetration
In summary, TAM shows the full opportunity, SAM shows the relevant opportunity, and SOM shows the realistic near-term opportunity.
Top-Down vs. Bottom-Up Market Sizing
Two common methods are used to estimate market size: top-down analysis and bottom-up analysis.
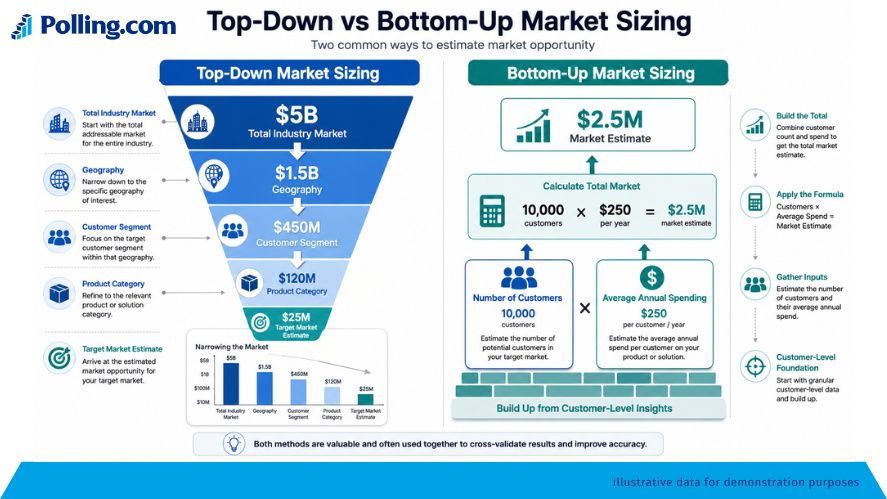
Although both methods can be useful, they produce the strongest results when used together.
Top Down Market Sizing
Top down market sizing begins with a broad industry estimate and narrows it using relevant filters.
For example, suppose a report estimates that the global employee wellness software market is worth $10 billion annually.
If North America accounts for 35% of the market, the regional opportunity would be:
$10 billion × 35% = $3.5 billion
Next, assume companies with 100 to 1,000 employees represent 30% of that regional spending.
$3.5 billion × 30% = $1.05 billion
Therefore, the relevant market estimate is $1.05 billion.
Advantages of Top-Down Market Sizing
Top-down analysis is fast and easy to understand. In addition, it works well when reliable industry reports are available.
It can help teams:
- Compare industries
- Understand broad market scale
- Support early planning
- Identify growing sectors
- Create an initial estimate
Limitations of Top-Down Market Sizing
The method may be less accurate when broad reports include categories, regions, or customer groups that do not match the company’s offer.
Furthermore, every percentage used to narrow the market adds another assumption. As a result, the final number may look precise even though the underlying data is uncertain.
Bottom Up Market Sizing
Bottom up market sizing starts with customer-level, unit-level, or transaction-level information.
The basic formula is:
Number of potential customers × Average annual revenue per customer
Suppose a company sells inventory software to independent retailers.
Assume 80,000 retailers fit the target profile and the average annual contract is $1,200.
The estimated market would be:
80,000 × $1,200 = $96 million per year
A more detailed bottom up approach market sizing calculation may divide customers into segments:
- 50,000 small retailers × $600 = $30 million
- 25,000 mid-sized retailers × $1,800 = $45 million
- 5,000 larger retailers × $4,200 = $21 million
The total market would still be:
$30 million + $45 million + $21 million = $96 million
However, the segmented model provides more insight into where the revenue comes from.
Advantages of Bottom-Up Market Sizing
Bottom-up analysis usually provides a more credible estimate because it connects directly to customer counts, prices, sales volumes, and purchasing behavior.
Additionally, the assumptions can be tested through:
- Customer interviews
- Survey responses
- Competitor pricing
- Internal sales data
- Pilot programs
- Transaction records
- Conversion rates
Limitations of Bottom-Up Market Sizing
The method still depends on accurate inputs. If the customer count is incomplete or the expected price is unrealistic, the estimate will be misleading.
Moreover, bottom-up analysis can require more time and research than a broad industry calculation.
Which Market Sizing Method Should You Choose?
Top-down analysis is useful when a company needs a quick view of an industry. By contrast, bottom-up analysis is better when planning revenue, sales capacity, or customer acquisition.
For important decisions, use both.
If a top-down estimate suggests a $1 billion market while the bottom-up estimate suggests only $80 million, investigate the difference. The gap may reveal inconsistent definitions, missing segments, or unrealistic assumptions.
A strong market sizing framework uses both methods as cross-checks.
How Surveys Improve Market Sizing Accuracy
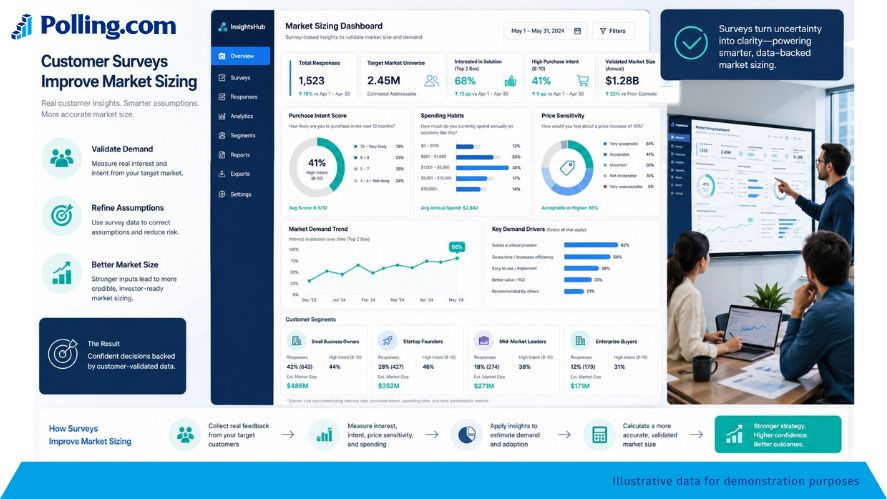
A market estimate can be mathematically correct but commercially wrong.
For example:
100,000 potential customers × $500 annual spending = $50 million
Although the arithmetic is accurate, the assumptions may not be.
Do all 100,000 people experience the problem? How many already buy a competing product? Is $500 a realistic annual spend? Would customers be willing to switch?
Without customer validation, the estimate may simply reflect what the company hopes will happen.
For this reason, survey research can significantly improve accuracy.
Surveys Measure Customer Demand
Surveys help determine how many people actually experience the problem the product addresses.
Suppose a business identifies 1 million consumers within its demographic and geographic criteria. After conducting a survey, the company discovers that only 18% experience the problem frequently enough to seek a solution.
The revised customer pool would be:
1,000,000 × 18% = 180,000 customers
Therefore, the market may be much smaller than the broad population suggests.
Surveys Measure Purchase Intent
A survey can also ask how likely respondents are to buy within a specific period.
Possible responses include:
- Definitely would purchase
- Probably would purchase
- Might or might not purchase
- Probably would not purchase
- Definitely would not purchase
However, stated intent should be treated cautiously because people often overestimate their future behavior. Consequently, companies should apply conservative conversion assumptions.
Surveys Reveal Spending Habits
Spending questions can validate revenue estimates.
Useful questions include:
- How much did you spend on this category last year?
- How often do you purchase?
- What did you pay for your most recent purchase?
- What monthly price would feel too expensive?
- Which features would justify a higher price?
These answers help teams estimate average annual customer value more realistically.
Surveys Help Estimate Market Penetration
Customer surveys can reveal which competing products people already use and how satisfied they are.
A competitive market is not always unattractive. In fact, existing spending may confirm that customers value the category.
Nevertheless, strong customer loyalty may reduce switching rates. Therefore, questions about satisfaction, contract length, and willingness to change providers can improve the SOM estimate.
Surveys Test Price Sensitivity
Price directly affects market size.
A higher price may increase revenue per customer but reduce demand. Meanwhile, a lower price may attract more buyers but weaken profit margins.
Survey results can support several scenarios:
- High price with low adoption
- Moderate price with moderate adoption
- Low price with high adoption
Instead of relying on one number, companies can create a range of possible outcomes.
Combine Surveys with Secondary Data
Surveys should complement industry reports rather than replace them.
A report may estimate how many potential customers exist, while a survey can estimate:
- Percentage with the relevant need
- Average annual spending
- Likelihood of switching
- Purchase frequency
- Expected adoption
- Price sensitivity
Together, these sources create a more reliable estimate.
How to Conduct a Market Sizing Survey
A useful survey should test specific assumptions within the market model.
Before writing questions, decide what the company needs to learn.
Define Your Target Audience
The right respondents should match the company’s actual customer profile.
Useful screening criteria may include:
- Age
- Location
- Income
- Industry
- Job title
- Company size
- Purchasing authority
- Current product usage
- Purchase frequency
- Relevant needs
Suppose a company sells payroll software to restaurants with 20 to 100 employees. Responses from freelancers or multinational companies would not be relevant.
For that reason, audience quality is often more important than response volume.
Ask the Right Market Sizing Questions
Effective market sizing questions focus on real behavior whenever possible.
Examples include:
- How often do you purchase this product?
- How much do you typically spend?
- Which brands do you currently use?
- How likely are you to switch?
- What factors influence your purchasing decision?
- When did you last buy a similar product?
- Who approves the purchase?
- What is your annual budget for this category?
- What prevents you from buying more often?
- Which features are essential?
Behavioral questions generally produce better evidence than broad opinion questions.
For example, “Do you like this idea?” may generate positive responses without showing true purchase intent.
A stronger question would be, “Which products in this category have you purchased during the past six months?”
Analyze Survey Results
After collecting responses, divide them into meaningful groups.
Possible segments include:
- Current buyers
- Non-buyers
- Frequent buyers
- Occasional buyers
- High-spending customers
- Price-sensitive customers
- Loyal competitor users
- Customers actively looking for alternatives
Next, estimate adoption conservatively.
Suppose 40% of qualified respondents say they would definitely buy. Using 40% as the expected penetration rate would likely be unrealistic. Instead, the company might model adoption at 5%, 10%, and 15%.
If the SAM contains 50,000 customers and the annual price is $600, projected revenue would be:
- 5% adoption: 2,500 customers × $600 = $1.5 million
- 10% adoption: 5,000 customers × $600 = $3 million
- 15% adoption: 7,500 customers × $600 = $4.5 million
Because the results are presented as a range, decision-makers can see how adoption assumptions affect revenue.
Avoid Weak Market Research Surveys
Well-designed market research surveys can strengthen an estimate. Poorly designed surveys, however, can create false confidence.
Common problems include:
- Leading questions
- Unqualified respondents
- Biased samples
- Confusing language
- Hypothetical answers
- Surveys that are too long
- Missing screening questions
Before launching a large survey, test it with a smaller group. This step helps identify unclear questions and missing response options.
Best Tools for Market Sizing Surveys
The best survey platform depends on research complexity, audience requirements, budget, and analysis needs.
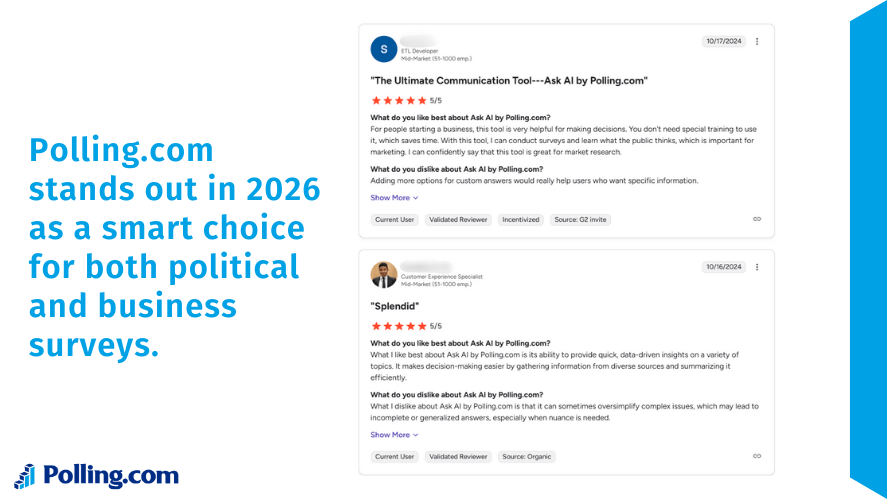
Polling.com
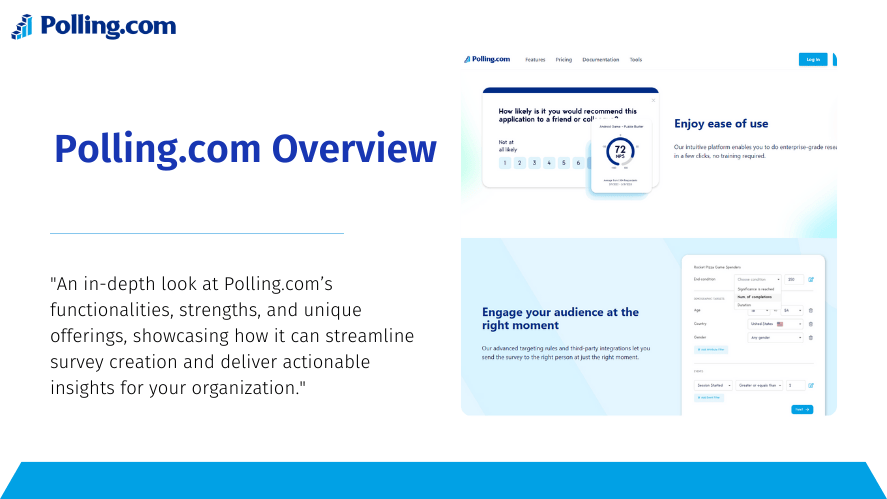
Polling.com is a practical option for businesses that want to validate market estimates with customer data.
Relevant features include:
- Advanced survey logic
- Audience targeting
- Built-in analytics
- Response purchasing
- Fast survey creation
These tools can help businesses reach a defined audience rather than relying only on public links or existing contacts.
For example, a company may screen participants by location, job role, company size, or buying behavior. It can then ask qualified respondents about spending, current providers, willingness to switch, and pricing expectations.
As a result, Polling.com can help validate market size using real customer responses instead of assumptions alone.
SurveyMonkey
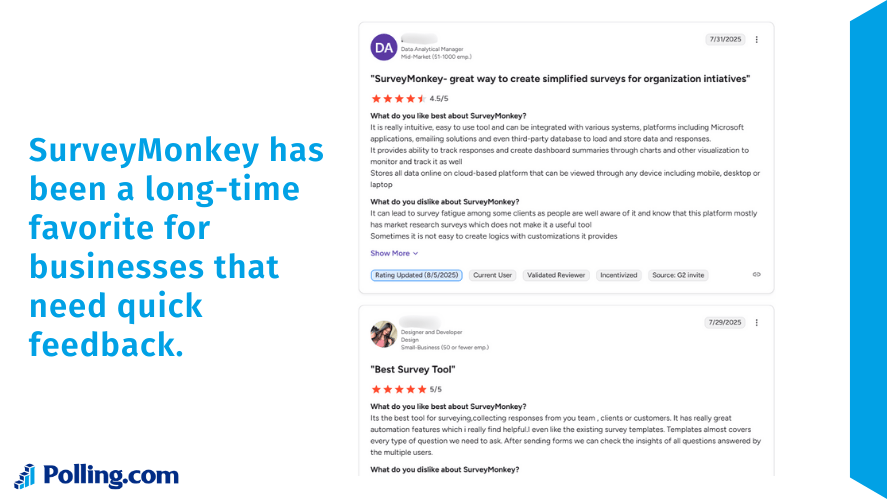
SurveyMonkey provides templates, survey logic, reporting tools, and several distribution options.
It can be useful for:
- Structured research projects
- Conditional question paths
- Team collaboration
- Customer feedback
- Response analysis
Its wide feature set supports both simple and advanced research.
Typeform
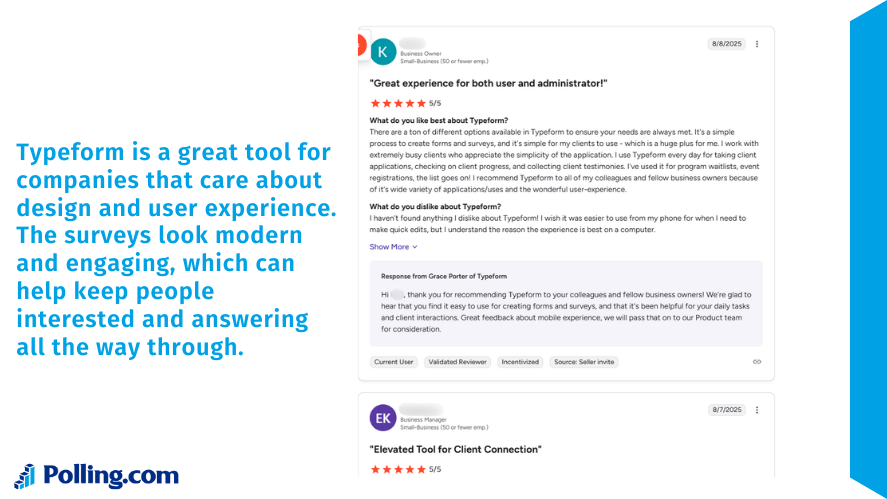
Typeform is known for its conversational design and one-question-at-a-time format.
Because the experience feels more interactive, it may improve engagement for concept testing, customer feedback, and product research.
Still, visual design does not guarantee reliable results. Audience quality and question design remain essential.
Google Forms
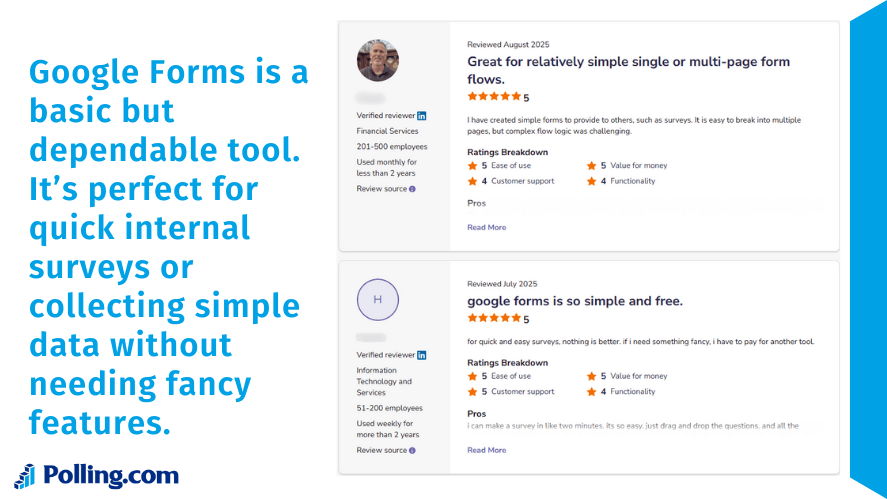
Google Forms is a simple and accessible option for basic surveys.
It works well for:
- Early-stage research
- Existing customer feedback
- Internal surveys
- Small pilot studies
- Community research
However, businesses may need additional tools to find and qualify respondents.
Common Market Sizing Mistakes
Even a detailed model can become misleading when the assumptions are weak.
Using Outdated Industry Reports
Markets change over time. Customer behavior, regulation, pricing, competition, and technology may all shift.
Therefore, older reports should be checked against newer data whenever possible.
Ignoring Customer Validation
Industry data can show that a category exists, but it does not prove that customers want a specific product.
Surveys, interviews, landing-page tests, and pilot programs can validate real demand.
Double-Counting Markets
Double-counting occurs when overlapping customer groups are added together.
For example, “small businesses,” “online retailers,” and “independent brands” may include many of the same companies.
Clear definitions prevent inflated totals.
Using Unrealistic Penetration Assumptions
Capturing “just 1%” of a billion-dollar market may sound conservative. In practice, even 1% can require major investment, strong distribution, and years of execution.
A better SOM estimate should reflect marketing reach, sales capacity, conversion rates, and competition.
Confusing TAM with Revenue
TAM is not expected revenue.
A large market only shows that demand may exist. The company must still prove that it can acquire, serve, and retain customers.
Treating Precision as Accuracy
A figure such as $127.4 million may appear credible. Nevertheless, extra decimal places do not make uncertain assumptions more accurate.
Often, a range is more useful than one highly specific number.
Market Sizing Example: SaaS Startup
Consider a SaaS company that offers appointment and customer-management software to independent fitness studios.
Step 1: Calculate TAM
Assume 150,000 fitness studios exist across all relevant countries. The annual subscription is $1,200.
TAM = 150,000 × $1,200
TAM = $180 million per year
Step 2: Calculate SAM
The company initially serves only English-speaking markets and studios with fewer than 20 employees.
Research identifies 45,000 matching studios.
SAM = 45,000 × $1,200
SAM = $54 million per year
Step 3: Calculate SOM
Based on its sales and marketing capacity, the company expects to acquire 1,800 studios within three years.
SOM = 1,800 × $1,200
SOM = $2.16 million per year
Afterward, the company could validate the estimate by surveying studio owners about current software, annual spending, satisfaction, and willingness to switch.
Market Sizing Example: Local Restaurant Chain
Suppose an entrepreneur plans to launch a healthy lunch restaurant chain in one city.
Step 1: Estimate the Customer Pool
Assume 600,000 adults live or work near the proposed locations.
Survey data indicates that 22% buy lunch away from home at least twice per week and actively seek healthier options.
600,000 × 22% = 132,000 potential customers
Step 2: Estimate Annual Spending
Assume each relevant customer makes 24 purchases per year at an average order value of $15.
24 × $15 = $360 annual spending per customer
Step 3: Calculate TAM
132,000 × $360 = $47.52 million per year
Step 4: Calculate SAM
The planned locations can conveniently serve 35% of those customers.
$47.52 million × 35% = $16.63 million
Step 5: Calculate SOM
Based on capacity and competition, the business expects to capture 6% of SAM.
$16.63 million × 6% = approximately $998,000 per year
Local survey data can then refine estimates for purchase frequency, average spending, preferred ordering methods, and travel distance.
Market Sizing Example: Ecommerce Business
Consider an ecommerce company selling premium ergonomic desk accessories.
Assume 8 million remote or hybrid professionals live in the selected region.
Survey results show that:
- 30% invest in home-office improvements
- 40% of that group prefer premium ergonomic products
The relevant customer pool would be:
8 million × 30% × 40% = 960,000 customers
If average annual spending is $180:
TAM = 960,000 × $180
TAM = $172.8 million per year
Suppose the company can ship profitably to regions representing 60% of the market.
SAM = $172.8 million × 60%
SAM = $103.68 million per year
Finally, based on inventory, website traffic, and advertising capacity, the company expects to serve 12,000 customers.
SOM = 12,000 × $180
SOM = $2.16 million per year
A Practical Market Sizing Cheat Sheet
Use this market sizing cheat sheet when preparing an estimate.
1. Define the Market
Clarify:
- Who the customers are
- What they purchase
- Where they are located
- Which need the product solves
- What time period the estimate covers
2. Choose the Unit
Measure the market using customers, companies, transactions, subscriptions, units, or revenue.
3. Calculate TAM
Use:
Total relevant customers × Average annual spending
4. Calculate SAM
Remove customers the business cannot currently serve because of geography, product fit, regulation, language, pricing, or delivery limits.
5. Calculate SOM
Estimate the number of customers the company can realistically acquire.
6. Validate Assumptions
Use surveys, interviews, competitor analysis, industry reports, government data, and sales records.
7. Build Scenarios
Create conservative, expected, and optimistic estimates.
Market Sizing Practice Question
Here is a market sizing practice question:
A company plans to sell bookkeeping software to independent contractors. There are 2 million contractors in its selected markets. Research suggests that 25% already pay for bookkeeping or finance tools. The annual price is $240. The company can serve 60% of the relevant market and expects to capture 2% of that segment.
Answer
Relevant customer base:
2 million × 25% = 500,000 customers
TAM:
500,000 × $240 = $120 million
SAM:
$120 million × 60% = $72 million
SOM:
$72 million × 2% = $1.44 million
This type of market sizing case tests whether an analyst can move logically from a broad population to a realistic revenue estimate.
How to Do Market Sizing
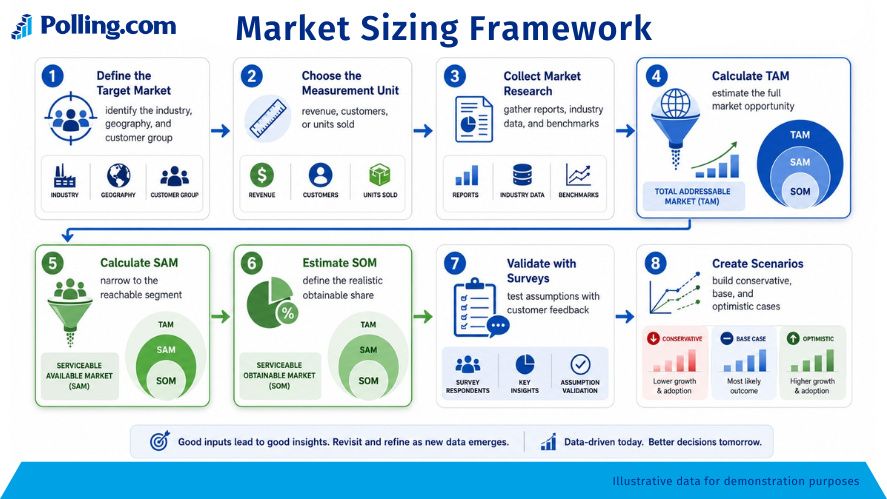
For anyone wondering how to do market sizing, follow this process:
- Define the customer precisely.
- Choose the unit of measurement.
- Gather reliable secondary data.
- Build a top-down estimate.
- Build a bottom-up estimate.
- Validate assumptions with surveys.
- Compare the results.
- Investigate major differences.
- Create several scenarios.
- Document every assumption.
Because markets change, the model should be updated whenever pricing, customer behavior, competition, or distribution changes.
When to Use Custom Market Sizing Services
Some companies can complete the work internally. Others may benefit from custom market sizing services, especially when entering an unfamiliar market or making a major investment.
External specialists may help with:
- Market definition
- Competitor analysis
- Survey design
- Audience sampling
- Statistical modeling
- International comparisons
- Demand forecasting
- Executive reporting
Even so, company leaders should understand the assumptions and data behind the final estimate.
Best Practices for Accurate Market Sizing
The strongest estimates combine several sources rather than relying on one report.
Combine Primary and Secondary Research
Industry data provides context, whereas surveys and interviews provide direct customer evidence.
Survey the Right Audience
Qualified respondents are essential. A large sample of irrelevant participants can produce misleading results.
Update Estimates Regularly
Revisit the model when:
- Pricing changes
- New competitors enter
- Customer behavior shifts
- Regulations change
- New regions open
- Additional sales channels become available
Validate Assumptions Continuously
Sales conversations, lost deals, churn reasons, customer support requests, and product usage can all improve the model.
Use Multiple Data Sources
Reliable estimates may combine:
- Industry reports
- Government statistics
- Company filings
- Competitor pricing
- Surveys
- Customer interviews
- Transaction data
- Internal sales records
Present a Range
Instead of stating that a market is exactly $250 million, show several scenarios.
For example:
- Conservative: $180 million
- Expected: $230 million
- Optimistic: $290 million
This approach makes uncertainty easier to understand.
Frequently Asked Questions
Market sizing helps businesses evaluate products, expansion plans, customer segments, investment opportunities, and sales forecasts.
No. TAM represents the broad theoretical opportunity, while realistic revenue depends on the portion the company can serve and capture.
Yes. A smaller market may still be profitable when customers spend more, remain loyal, and face few alternatives.
Ideally, startups should use both. Top-down analysis provides context, while bottom-up analysis connects the estimate to real customers and pricing.
Companies should update market sizing research whenever important assumptions change, including pricing, competition, customer behavior, regulation, and sales capacity.
Conclusion
Market sizing is not about creating the biggest number possible. Instead, it is about understanding the size, quality, and accessibility of a business opportunity.
TAM represents the broad market. SAM narrows that figure to the customers a company can serve. SOM estimates the portion the business can realistically capture.
Top-down analysis provides useful industry context. Meanwhile, bottom-up analysis connects the opportunity to real customer counts, prices, and operational limits. When used together, the two methods create a stronger estimate.
Most importantly, companies should validate assumptions with real customer evidence. Industry data may show that a category exists, but surveys reveal whether customers experience the problem, how much they spend, and whether they are willing to switch.
Therefore, businesses should combine reports, competitor data, customer surveys, and internal information before making major strategic decisions. A well-supported estimate can expose weak opportunities early, confirm strong demand, and guide smarter investments.