
Factor Analysis for Surveys: When to Use It and How It Works

Large surveys often collect hundreds or even thousands of responses. While that data is valuable, it can also be difficult to interpret.
Factor analysis helps simplify complex survey data by grouping related questions into a smaller number of meaningful factors.
Survey researchers use factor analysis to understand the hidden patterns behind survey responses.
Instead of looking at every question individually, they can identify the underlying concepts that influence how people answer.
This method is widely used by businesses, marketers, HR teams, healthcare professionals, educators, researchers, and students to better understand survey data.
In this guide, you’ll learn what factor analysis is, when to use it, how it works, and how to apply it to survey data with confidence.
What Is Factor Analysis?
Before learning how factor analysis works, it’s important to understand the basic concepts behind this statistical method.
Definition of Factor Analysis
Factor analysis is a statistical method used to identify the underlying relationships between survey questions.
It examines how responses are connected, and groups related questions into a smaller number of hidden factors.
These hidden factors are called latent variables because they cannot be measured directly.
The individual survey questions are known as observed variables, since they capture responses that researchers can collect and analyze.
For example, a customer satisfaction survey might ask about product quality, ease of use, customer support, and value for money.
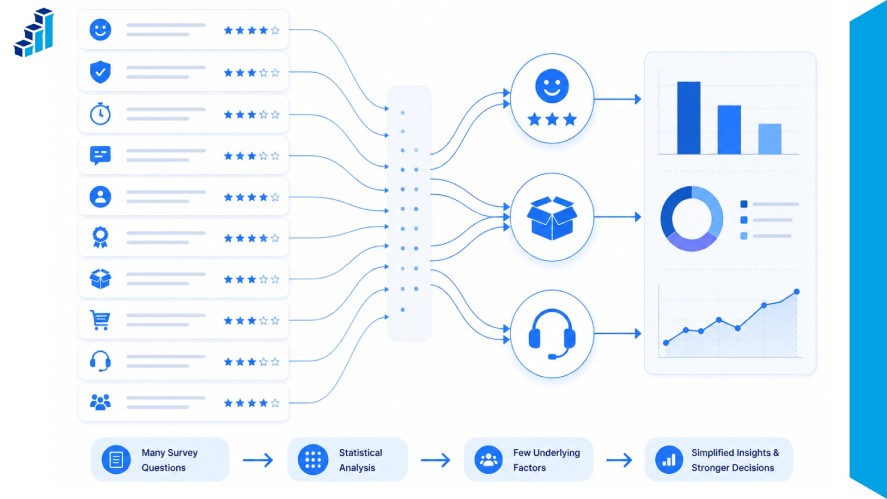
Although respondents answer each question separately, factor analysis may show that they all measure the same underlying concept: overall customer satisfaction.
By identifying these hidden factors, researchers can measure complex ideas more accurately and reduce large sets of survey questions into meaningful dimensions.
Why Factor Analysis Matters in Survey Research
Many surveys include dozens of questions that measure similar survey topics. Without factor analysis, interpreting all of those responses can be time-consuming and confusing.
Factor analysis groups related questions into meaningful dimensions, making survey data easier to analyze and explain.
It also uncovers hidden patterns that may not be obvious when reviewing individual responses.
Another important benefit is survey validation.
Researchers often use factor analysis to confirm whether a group of questions measures the same underlying concept, such as employee engagement, brand trust, or customer loyalty.
This leads to stronger measurement scales, higher-quality research, and more reliable business decisions.
How Factor Analysis Works
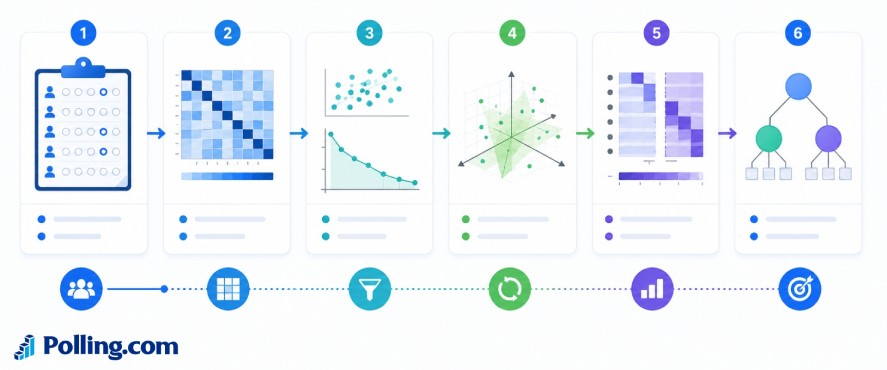
Factor analysis follows a series of steps to identify patterns in survey data.
Understanding this process makes it easier to interpret your survey results and evaluate the quality of your measurement scales.
Identifying Relationships Between Survey Questions
The first step in factor analysis is identifying relationships between survey questions.
Questions that measure the same underlying concept often receive similar responses from participants.
For example, a customer satisfaction survey may ask respondents to rate product quality, ease of use, and overall value.
If people who rate one of these items highly also tend to rate the others highly, the questions are likely measuring the same latent factor.
Finding these relationships helps researchers decide which questions belong together before creating meaningful factors.
Correlation Matrix
A correlation matrix is a table that shows how strongly every survey question is related to the others.
Factor analysis uses this matrix as the starting point for identifying hidden patterns.
Questions with strong positive correlations are more likely to measure the same concept. Questions with little or no correlation usually belong to different factors.
For example, questions about customer service response time and staff friendliness may show strong correlations, while a question about product pricing may form part of a different factor.
Factor Extraction
After identifying the correlations, the next step in the analysis of factors is to extract the factors.
The goal is to reduce many survey questions into a smaller number of meaningful dimensions without losing important information.
Suppose a survey contains 20 questions about employee engagement.
Factor extraction may reveal that those questions can be grouped into four factors, such as leadership, communication, career growth, and workplace culture.
This process simplifies large datasets and makes survey results easier to analyze.
Factor Rotation
Factor rotation reorganizes the extracted factors to make them easier to interpret.
It does not change the underlying data. Instead, it creates a clearer separation between factors.
The two most common rotation methods are:
- Orthogonal Rotation: assumes that the factors are independent and not related to one another. A common method is Varimax rotation.
- Oblique Rotation: allows factors to be correlated. This approach is often more realistic in survey research because concepts such as trust, satisfaction, and loyalty frequently influence each other.
The appropriate rotation method depends on your research objectives and whether you expect the underlying factors to be related.
Interpreting Factor Loadings
A factor loading shows how strongly each survey question is associated with a factor.
The higher the loading, the more closely that question measures the underlying concept.
For example, imagine a customer satisfaction factor with the following loadings:
| Survey Question | Factor Loading |
|---|---|
| Product Quality | 0.87 |
| Ease of Use | 0.82 |
| Value For Money | 0.79 |
| Customer Support | 0.41 |
In this example, product quality, ease of use, and value for money strongly represent the customer satisfaction factor.
Customer support has a weaker relationship and may belong to another factor or require further review.
By interpreting factor loadings, researchers can identify the strongest questions, remove weak items, and better understand how to analyze survey results using meaningful factors.
Types of Factor Analysis
Not all factor analysis serves the same purpose.
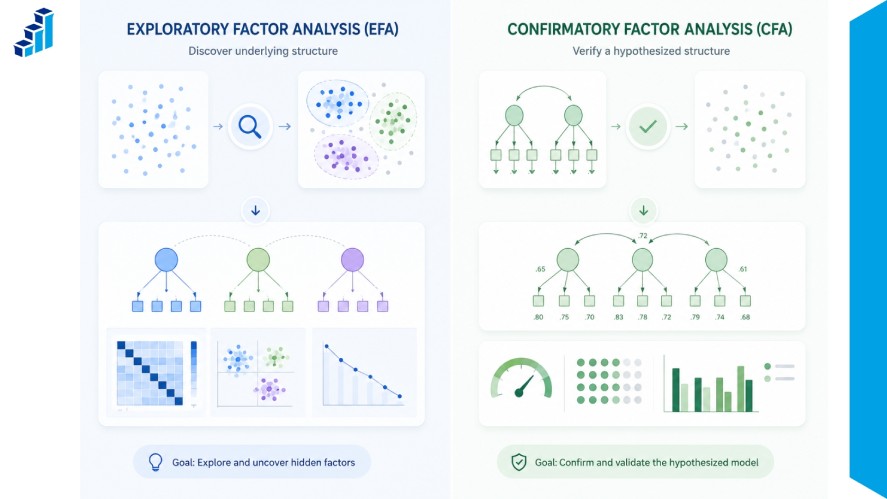
Researchers typically use one of two approaches in Multiple Factor Analysis workflows, depending on their goals: Exploratory Factor Analysis (EFA) or Confirmatory Factor Analysis (CFA).
Exploratory Factor Analysis (EFA)
Exploratory Factor Analysis (EFA) is used when researchers are not sure how survey questions will group together.
Its purpose is to explore the data and discover hidden constructs without imposing predefined assumptions.
EFA is often used during the early stages of questionnaire development.
For example, if a company creates a new employee engagement survey, researchers may use EFA to determine whether the questions naturally group into factors such as leadership, communication, recognition, and career development.
Use EFA when:
- Developing a new survey or measurement scale
- Exploring relationships among survey questions
- Identifying hidden dimensions in the data
- No established theoretical model exists
Because EFA is data-driven, it helps researchers uncover patterns that may not have been anticipated when the survey was designed.
Confirmatory Factor Analysis (CFA)
Confirmatory Factor Analysis (CFA) is used when researchers already have a theory or expected factor structure and want to test whether the data support it.
Instead of discovering factors, CFA evaluates whether survey responses fit a predefined model.
For example, a researcher may believe that a customer satisfaction questionnaire measures three dimensions: product quality, service quality, and value.
CFA can test whether the collected data matches that structure.
CFA is commonly used to:
- Validate existing survey instruments
- Test theoretical models
- Confirm results from previous EFA studies
- Evaluate the quality of measurement scales
By comparing expected and observed relationships, CFA provides evidence that a questionnaire measures the intended concepts.
EFA vs CFA
Although both methods examine relationships among survey questions, they are used at different stages of research.
| Feature | Exploratory Factor Analysis (EFA) | Confirmatory Factor Analysis (CFA) |
|---|---|---|
| Purpose | Discover hidden factors | Test an existing factor structure |
| Research Stage | Early-stage research | Later-stage validation |
| Hypothesis Requirement | No predefined hypothesis required | Requires a predefined model or theory |
| Typical Applications | New questionnaires, exploratory studies, scale development | Survey validation, theory testing, instrument confirmation |
| Output | Identified factors and question groupings | Goodness-of-fit measures and model validation |
In many survey research projects, EFA and CFA are used together.
Researchers often begin with EFA to identify potential factors and then use CFA to confirm that the structure remains valid with a new dataset.
This combination helps create more reliable and scientifically sound survey instruments, improving the connection between the survey and results.
When Should You Use Factor Analysis?
Here are some common situations where factor analysis can add value.
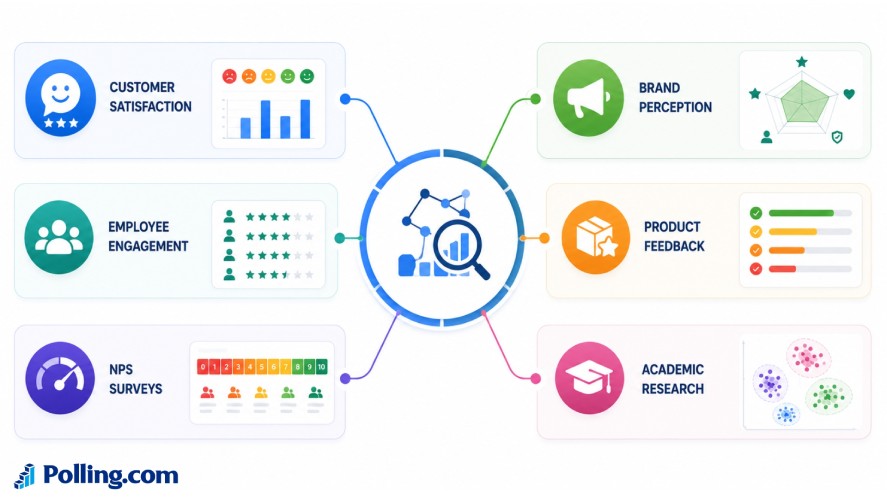
Customer Satisfaction Surveys
Customer satisfaction surveys often include questions about product quality, customer service, pricing, ease of use, and overall experience.
Factor analysis can group these responses into broader dimensions, making it easier to identify which areas have the greatest impact on customer satisfaction.
Employee Engagement Surveys
Employee engagement surveys usually measure topics such as leadership, communication, recognition, career growth, and workplace culture.
Factor analysis helps HR teams understand how these questions cluster together and identify the key drivers of employee engagement.
Net Promoter Score (NPS) Follow-Up Surveys
An NPS survey tells you how likely customers are to recommend your business, but follow-up questions explain why they gave that score.
Factor analysis can organize these responses into themes, such as product quality, customer support, pricing, or usability.
This helps teams focus on the biggest opportunities for improvement.
Brand Perception Surveys
Brand perception surveys often ask respondents about trust, innovation, value, quality, and reputation.
Factor analysis can reveal which of these attributes form the strongest dimensions of brand perception and how they influence customer opinions.
Product Feedback Surveys
Product feedback surveys collect opinions on features, performance, design, reliability, and ease of use.
Factor analysis helps group related feedback so product teams can prioritize improvements instead of reviewing every question individually.
Political Opinion Polling
Political polling often includes many questions about policy preferences, voting behavior, public trust, and candidate opinions.
Factor analysis can identify broader themes that explain how different attitudes are connected across the survey.
Academic Questionnaires
Researchers frequently use factor analysis to validate questionnaires that measure concepts such as satisfaction, motivation, stress, wellbeing, or learning outcomes.
It helps confirm that survey questions accurately measure the intended constructs before the questionnaire is used in larger studies.
No matter the industry, factor analysis works best when you want to measure complex ideas using multiple related survey questions.
It helps transform large sets of survey responses into meaningful insights that support better decisions.
Requirements Before Running Factor Analysis
Factor analysis only produces meaningful results when your survey data meets certain requirements.
Taking these steps helps ensure your results are accurate and reliable.
Adequate Sample Size
A large enough sample is one of the most important requirements for factor analysis. Small datasets can produce unstable factors and unreliable conclusions.
There is no single minimum sample size, but common recommendations include:
- At least 100 respondents for smaller surveys.
- 200–300 respondents for more reliable results.
- Between 5 and 10 respondents per survey question (variable). For example, a survey with 20 questions should ideally have 100–200 completed responses.
Larger samples generally produce more stable factor structures and provide more reliable survey benchmarks for future comparisons and trend analysis.
Correlated Variables
Factor analysis looks for relationships between survey questions, so the variables must be correlated.
If the questions are unrelated, factor analysis will not identify meaningful factors.
For example, questions about product quality, ease of use, and customer satisfaction may be strongly correlated because they measure similar experiences.
However, a question about the respondent’s age may not belong in the same factor because it measures something different.
A correlation matrix is often reviewed first to confirm that enough meaningful relationships exist.
Suitable Measurement Scales
Factor analysis works best with questions that use consistent rating scales.
Likert scales, such as 1–5 or 1–7 agreement scales, are the most common choice because they measure attitudes and opinions consistently.
Remember that using different response formats throughout the same questionnaire can make the results harder to interpret.
KMO Measure
The Kaiser-Meyer-Olkin (KMO) Measure evaluates whether your data is suitable for factor analysis by measuring sampling adequacy.
| KMO Value | Interpretation |
|---|---|
| 0.90 or above | Excellent |
| 0.80–0.89 | Very good |
| 0.70–0.79 | Good |
| 0.60–0.69 | Acceptable |
| Below 0.60 | Factor analysis is generally not recommended |
A KMO value of 0.70 or higher is usually considered appropriate for most survey research.
Bartlett’s Test of Sphericity
Bartlett’s Test of Sphericity checks whether the survey questions are correlated enough to perform factor analysis.
A statistically significant result (p < 0.05) indicates that the variables are sufficiently related and that factor analysis is appropriate.
If the test is not significant, the survey questions may not share enough common variance to form meaningful factors.
Researchers typically review both the KMO Measure and Bartlett’s Test before running factor analysis.
Together, these tests help confirm that the survey data is suitable for producing reliable and interpretable results.
Step-by-Step Guide to Performing Factor Analysis
Running factor analysis is an important step in learning how to do analysis of survey data. Here’s how to perform factor analysis in 6 steps.
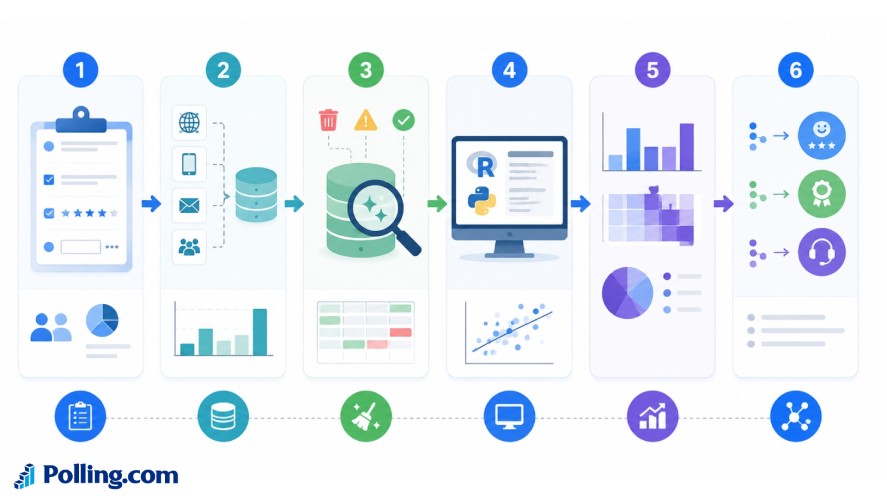
Step 1: Design a Survey with Multiple Related Questions
Before collecting responses, it’s important to understand how to write survey questions that measure the same underlying concept.
For example, if you want to measure customer satisfaction, include multiple questions about product quality, ease of use, value for money, and customer support instead of relying on a single question.
Using consistent rating scales, such as a 5-point Likert scale, also improves the quality of your analysis.
Polling.com makes creating survey questions easier by helping you build structured surveys with customizable question types, consistent response scales, and survey logic before you begin collecting data.
Step 2: Collect High-Quality Survey Responses
The quality of your analysis depends on the quality of your data.
Collect enough responses from your target audience and make sure participants understand the questions.
Before starting the analysis, review your survey response rate and check for incomplete or duplicate responses that could affect the results.
Step 3: Clean the Data
Before running factor analysis, prepare your dataset by removing errors and inconsistencies.
Common data-cleaning tasks include:
- Removing incomplete responses
- Correcting data entry errors
- Handling missing values
- Checking for duplicate responses
- Confirming that response scales are coded consistently
Clean data produces more reliable factors and reduces the chance of misleading results.
Step 4: Run Factor Analysis Using Statistical Software
Once the data is ready, you can perform factor analysis using statistical software. Popular survey tools include:
- R: Free and widely used for statistical analysis.
- SPSS: A popular choice for survey research with built-in factor analysis tools.
- Python: Flexible for data analysis using libraries such as pandas and factor_analyzer.
- SAS: Common in enterprise and healthcare research.
- Stata: Frequently used in academic and social science research.
Most software follows the same basic workflow: calculate correlations, extract factors, apply a rotation method, and review the factor loadings.
Step 5: Interpret the Results
After the analysis is complete, examine the factor loadings to see which questions belong to each factor.
Questions with high loadings on the same factor usually measure the same underlying concept.
Also, review the total variance explained and check whether the factors make sense based on your research objectives.
If some questions load weakly or appear in multiple factors, you may need to revise or remove them.
Step 6: Name the Factors
The final step is giving each factor a clear and meaningful name based on the questions it contains.
| Survey Questions | Factor Name |
|---|---|
| Product quality, reliability, performance | Product Quality |
| Response time, helpfulness, issue resolution | Customer Support |
| Ease of navigation, interface, onboarding | User Experience |
Well-named factors make your survey results analysis easier to understand and communicate.
Rather than reporting dozens of individual questions, you can simplify your survey results presentation by presenting a small number of meaningful dimensions that summarize your survey findings.
Example of Factor Analysis in a Customer Satisfaction Survey
A practical example makes it easier to understand how factor analysis works.
Imagine a restaurant conducts a customer satisfaction survey with 15 questions covering different parts of the dining experience.
Instead of reviewing each question individually, factor analysis groups related responses into a few meaningful factors.

Survey Questions Examples
The survey includes polling questions such as:
- How would you rate the taste of the food?
- Was your meal served at the right temperature?
- Was the staff friendly and helpful?
- Were you satisfied with the speed of service?
- Did the prices offer good value?
- Was the restaurant clean?
- Was the dining area comfortable?
- How would you rate the overall atmosphere?
After collecting enough survey responses, factor analysis identifies patterns in how customers answered these questions.
Example Results
| Survey Questions | Identified Factor |
|---|---|
| Food taste, freshness, presentation | Food Quality |
| Staff friendliness, service speed, order accuracy | Service Quality |
| Menu prices, value for money | Pricing |
| Dining area cleanliness, restroom cleanliness | Cleanliness |
| Music, lighting, decor, comfort | Atmosphere |
Rather than reporting 15 separate questions, the restaurant now has five key dimensions that summarize the customer experience.
Turning Survey Results Into Action
These factors make it easier to identify strengths and weaknesses. For example, the results may show:
| Factor | Average Score | Business Insight |
|---|---|---|
| Food Quality | 4.7 / 5 | Major strength that attracts repeat customers |
| Service Quality | 3.9 / 5 | Staff training could improve customer experience |
| Pricing | 3.5 / 5 | Customers perceive prices as slightly high |
| Cleanliness | 4.6 / 5 | Cleanliness meets customer expectations |
| Atmosphere | 4.1 / 5 | Small improvements could enhance the dining experience |
Instead of guessing what customers value most, managers can prioritize improvements based on the factors with the lowest scores.
In this example, investing in employee training and reviewing pricing strategies would likely have a greater impact than making changes to food quality or cleanliness.
This is why factor analysis is so valuable in survey data analysis.
It transforms large sets of survey responses into clear, actionable insights that help businesses make better decisions.
Advantages of Factor Analysis
Factor analysis offers several benefits for survey research.
It simplifies large datasets, uncovers hidden relationships, and helps researchers build more reliable measurement scales.
Instead of analyzing every question separately, you can focus on the key factors that explain most of the variation in your survey responses.
One of its biggest strengths is that it reduces complexity.
Rather than reporting results from 30 or 40 individual questions, you can summarize them into a handful of meaningful dimensions.
It also helps improve survey validity by showing whether related questions measure the same concept.
At the same time, it can reveal redundant questions that could be removed in future versions of the survey, resulting in shorter questionnaires without sacrificing data quality.
For businesses and researchers, these insights support better decision-making because trends become easier to interpret and communicate.
Limitations of Factor Analysis
Although factor analysis is a powerful technique, it is not suitable for every survey.
The quality of the results depends heavily on both the questionnaire design and the data collected.
A common challenge is sample size. Small datasets often produce unstable factors that may not appear in another sample.
Poorly written or unrelated questions can also weaken the analysis because factor analysis assumes that variables share meaningful relationships.
Another limitation is interpretation.
While statistical software groups related questions together, researchers still decide what each factor represents.
Different researchers may assign different labels to the same factor based on their understanding of the data.
Finally, remember that factor analysis identifies correlations, not cause-and-effect relationships.
Finding two variables in the same factor does not mean one causes the other.
Common Mistakes to Avoid
Many problems with factor analysis begin long before the statistical analysis starts. Most can be avoided with careful survey design and preparation.
Some of the most common mistakes include:
- Using too few respondents.
- Including unrelated survey questions.
- Ignoring questions that load onto multiple factors.
- Confusing factor analysis with principal component analysis (PCA).
- Running confirmatory factor analysis before exploring the data.
Taking time to design a strong questionnaire and review the results carefully will produce more meaningful and reliable factors.
Best Practices for Survey Factor Analysis
Successful factor analysis starts with good survey design.
Questions should measure the same underlying construct, use consistent response scales, and be tested with the intended audience before launch.
Researchers should also combine factor analysis with other validation methods.
Reliability testing, pilot surveys, expert review, and clear documentation all help strengthen the quality of the final questionnaire.
Before publishing your findings, review each factor carefully and confirm that the grouped questions make theoretical and practical sense.
A statistically strong model is most valuable when it is also easy to explain and apply.
Factor Analysis vs Principal Component Analysis
Factor analysis and Principal Component Analysis (PCA) are often confused because both reduce large datasets into a smaller number of variables.
However, they have different goals and are used for different types of analysis.
| Feature | Factor Analysis | Principal Component Analysis |
|---|---|---|
| Goal | Identify hidden factors that explain relationships between variables | Reduce the number of variables while preserving as much variance as possible |
| Assumptions | Assumes observed variables are influenced by underlying latent factors | Does not assume latent variables. It focuses on the mathematical structure of the data |
| Output | A set of interpretable factors and factor loadings | A set of principal components ranked by explained variance |
| Statistical Model | Models shared variance among variables | Uses linear combinations of the original variables |
| Best Use Cases | Survey validation, questionnaire development, psychological research, market research | Data reduction, feature extraction, preprocessing for machine learning |
| Survey Applications | Validating constructs such as satisfaction, trust, or engagement | Summarizing large survey datasets before further analysis |
If your goal is to understand what your survey questions are measuring, factor analysis is usually the right method.
If you simply want to reduce the number of variables without identifying underlying constructs, PCA is often the better choice.
Some researchers also use PCA as an exploratory step before applying more advanced statistical techniques.
Still, it should not be treated as a replacement for factor analysis when validating survey measures.
How Polling.com Supports Better Survey Analysis
Strong data analysis in survey research starts with high-quality survey data.
Polling.com helps organizations conduct a survey, collect reliable responses, and prepare data for advanced analysis such as factor analysis.
Build Better Surveys with Polling.com
Polling.com offers features that support every stage of the survey process, from creating a simple feedback form to building advanced research surveys, including:
- Easy drag-and-drop survey builder
- Standardized question types and rating scales
- Customizable survey templates
- Survey logic and branching
- High-quality data collection
- Real-time dashboards and reporting
- Export to Excel, CSV, SPSS, R, and Python workflows
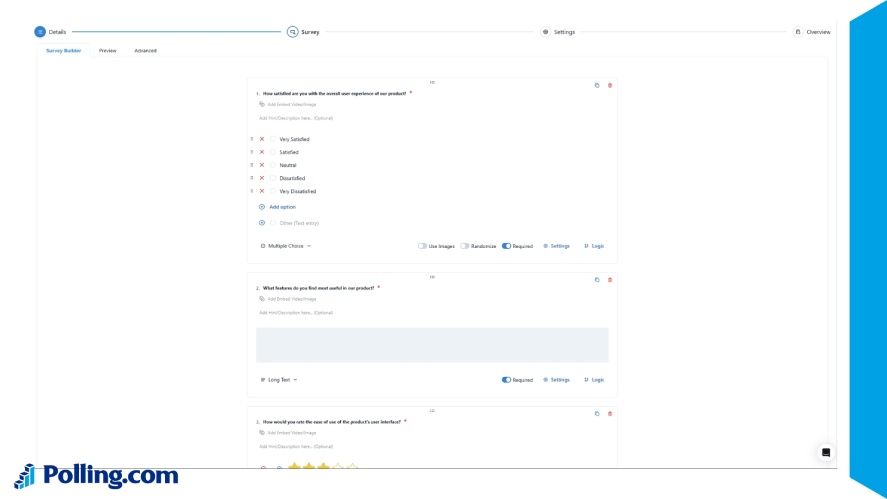
These features help researchers collect cleaner, more consistent data, making advanced techniques like factor analysis more accurate and showing how to present survey results more effectively.
How Polling.com Compares with Other Survey Platforms
Other popular survey platforms include SurveyMonkey, Typeform, Google Forms, and Qualtrics.
While each offers survey creation capabilities, Polling.com combines an intuitive interface, flexible survey design, robust reporting, and seamless data exports.
This makes it a strong choice for organizations that plan to perform advanced survey data analysis.
Frequently Asked Questions
Factor analysis is a statistical method that groups related survey questions into underlying factors or constructs. It helps researchers simplify large datasets, identify hidden patterns, and determine whether multiple questions measure the same concept, such as customer satisfaction or employee engagement.
Factor analysis identifies hidden factors that explain relationships between survey questions, while Principal Component Analysis reduces the number of variables by creating new components that capture the most variation in the data. Factor analysis is generally used for survey validation, whereas PCA is mainly used for data reduction.
There is no single minimum sample size, but many researchers recommend at least 100–200 responses. Another common guideline is to collect 5–10 respondents for every survey variable.
Many statistical programs support factor analysis, including SPSS, R, Python, SAS, and Stata. These tools provide functions for exploratory factor analysis (EFA), confirmatory factor analysis (CFA), and related statistical tests such as Cronbach’s Alpha, KMO, and Bartlett’s Test.
Factor analysis does not directly improve reliability, but it helps identify questions that do not fit well with the underlying construct. Removing or revising weak questions can lead to more consistent measurement when combined with reliability testing, such as Cronbach’s Alpha.
Use exploratory factor analysis (EFA) when you want to discover the underlying structure of your survey without predefined assumptions. Use confirmatory factor analysis (CFA) when you already have a theoretical model and want to test whether your survey data fits that expected structure.
Conclusion
Factor analysis is one of the most valuable techniques for understanding complex survey data.
By grouping related questions into meaningful factors, it helps researchers uncover hidden insights, validate measurement scales, and make survey results easier to interpret.
Successful factor analysis starts long before the statistical analysis itself.
Clear survey design, reliable data collection, pilot testing, and thoughtful validation all contribute to stronger results and more confident decision-making.
With Polling.com, you can build well-structured surveys, collect high-quality responses, and export your data to your preferred analysis tools.
Whether you’re conducting customer research, employee engagement studies, or academic research, Polling.com provides a strong foundation for advanced survey analysis.