
What is a Good Survey Response Rate for Your Industry?
Survey response rate is the percentage of people who complete your survey out of everyone who was invited.
A higher survey response rate usually means your data reflects a larger and more representative portion of your audience.
This leads to more reliable insights, better strategic decisions, and greater confidence.
On the other hand, low response rates can create gaps in your data, increasing the risk of bias and inaccurate conclusions.
Improving response rates helps ensure you capture enough meaningful feedback to support real business decisions.
But, what is a good survey response rate? And how can you improve it?
This is where the right tools make a difference.
Modern survey platforms like Polling.com help increase response rates by improving survey design, optimizing delivery timing, supporting multiple distribution channels, and reducing friction for respondents.
These features make it easier for people to participate, resulting in higher completion rates and better-quality insights.
What is a Survey Response Rate?
Survey response rate measures how many people completed your survey compared to how many people were invited.
It is one of the most important metrics for evaluating the effectiveness of a survey campaign.
Survey Response Rate Definition
Here’s how to calculate survey response rate.
The survey response rate is calculated using a simple formula:
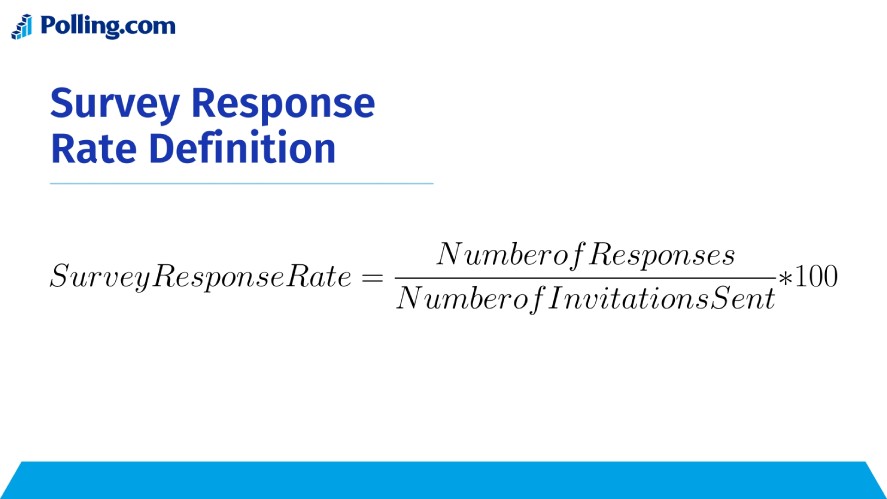
For example, if you send a survey to 1,000 customers and 250 of them complete it, your survey response rate would be: (250 ÷ 1,000) × 100 = 25%
This means one out of every four invited participants responded to your survey.
This survey response percentage helps you quickly evaluate how engaging, accessible, and relevant your survey is to your audience.
Why Survey Response Rates Matter
Survey response rates directly impact the quality and usefulness of your data.
First, higher response rates improve data reliability. When more people participate, your results better reflect the true opinions and experiences of your audience.
Second, strong response rates reduce non-response and survey response bias.
This happens when only certain types of people respond, which can skew results and lead to inaccurate conclusions.
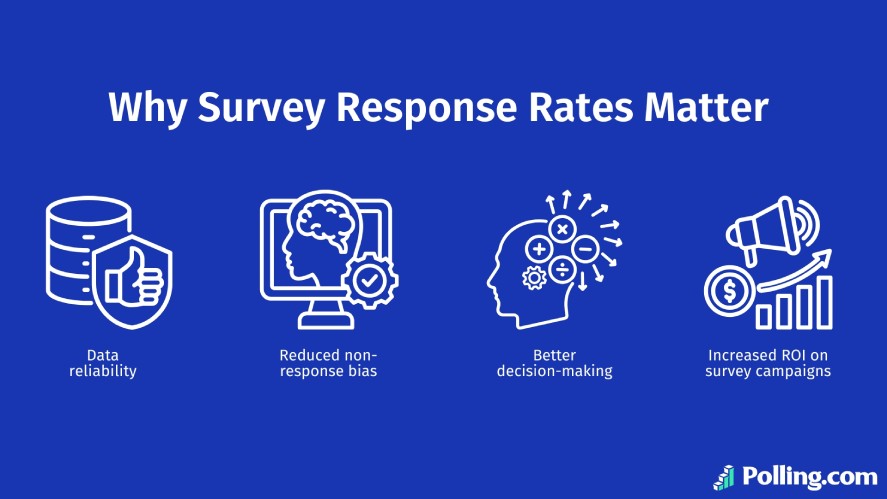
Third, response rates support better decision-making.
Whether you’re measuring customer satisfaction, employee engagement, or product feedback, higher participation gives you a clearer and more complete picture.
Finally, improving response rates increases the ROI of your survey campaigns.
More responses mean more actionable insights from the same effort. It helps your organization make smarter, data-driven decisions.
What is a Good Survey Response Rate?
A good survey response rate depends on the type of survey, your audience, and how the survey is delivered.
While there is no single universal benchmark, understanding typical response rate ranges by survey type helps you evaluate your performance and set realistic expectations.
Average Survey Response Rates by Survey Type
Here are the normal survey response rates of the most common survey types.
Email Surveys: 10%–30%
Email surveys are one of the most common distribution methods, but response rates can vary widely.
A typical survey response rate for email surveys ranges between 10% and 30%.
Several factors influence performance, including the quality of your email list, how well your audience recognizes your brand, and how compelling your subject line is.
Clean, targeted contact lists and personalized invitations often produce higher response rates, while generic bulk emails tend to perform worse.
Customer Satisfaction Surveys (CSAT & NPS): 20%–40%
Customer satisfaction surveys, including CSAT and NPS, typically achieve response rates between 20% and 40%.
These surveys perform better because they are usually triggered immediately after a customer interaction, such as a purchase or support conversation.
When surveys are sent while the experience is still fresh, customers are more motivated to share feedback.
Automated delivery through in-app prompts, email triggers, or post-transaction workflows can significantly improve participation.
Employee Surveys: 30%–60%
Employee engagement surveys often achieve higher response rates, typically ranging from 30% to 60%.
Since employees are part of the organization, they are more likely to participate. This is especially true when they believe their feedback will lead to meaningful improvements.
Trust and anonymity play a critical role here. When employees feel their responses are confidential and valued, participation increases.
Clear communication from leadership and easy access to the survey also contribute to stronger response rates.
Political and Public Opinion Polls: 5%–15%
Political and public opinion surveys often have lower response rates, typically between 5% and 15%.
This is especially common in phone surveys and online polling panels.
Response rates in this category have declined over time due to survey fatigue, privacy concerns, and increased screening of unknown calls or messages.
Despite lower participation, these surveys can still produce accurate results when the sample is properly designed and statistically weighted.
What Impacts Survey Response Rates?
Survey response rates are influenced by several factors, including how the survey is designed, when it is sent, and who receives it.
Optimizing these elements can significantly improve participation and help you collect more reliable feedback.
Survey Length and Design
Survey length is one of the most important factors affecting response rates.
Short surveys consistently perform better because respondents are more willing to complete them when they know it will only take a few minutes.
Clear, unbiased questions also improve completion rates.
Confusing or leading questions create friction and reduce trust, which can cause respondents to abandon the survey midway.
So, each question should be easy to understand and directly relevant to the respondent’s experience.
Mobile-friendly design is equally critical.
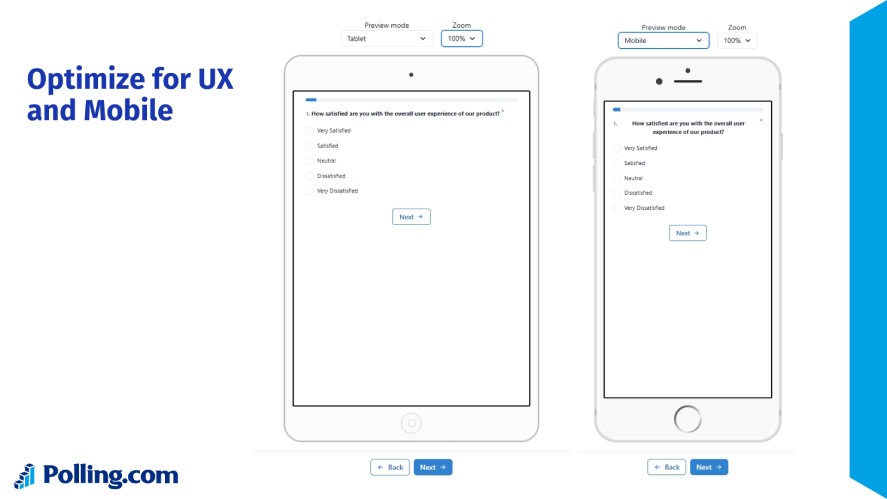
A large percentage of surveys are completed on smartphones, so surveys must display properly on smaller screens, load quickly, and require minimal typing.
Platforms like Polling.com help improve survey response rates by optimizing survey flow, reducing unnecessary steps, and providing user-friendly layouts that minimize drop-off during completion.
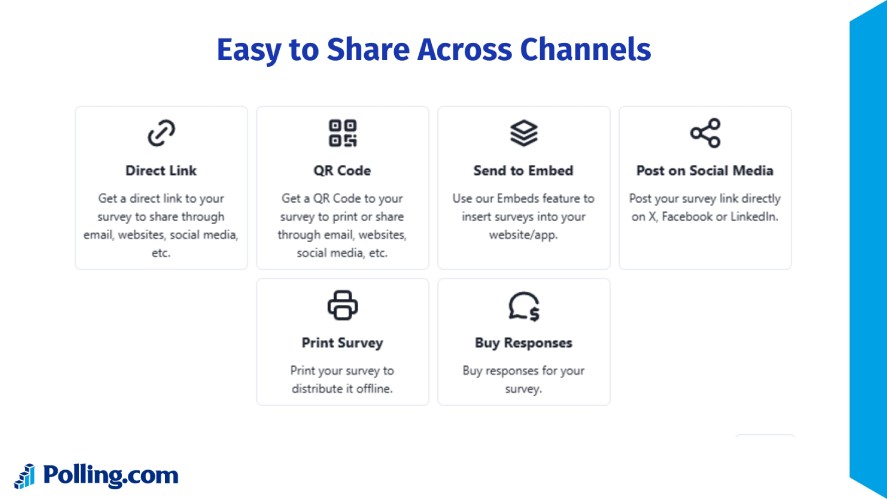
Timing and Distribution Channel
The channel you use to distribute surveys plays a major role in determining how many people respond.
Email surveys are widely used and effective when sent to engaged audiences, while SMS surveys often achieve higher response rates due to their immediacy and visibility.
In-app surveys and website popups can be especially effective because they reach users while they are actively interacting with your product or service.
This contextual timing increases relevance and encourages participation.
The timing of delivery also matters.
Surveys sent shortly after an interaction typically perform better because the experience is still fresh in the respondent’s mind.
Lastly, using a multi-channel approach can further improve results.
Combining email, in-app prompts, and other channels ensures broader coverage and increases the likelihood of reaching respondents through their preferred communication method.
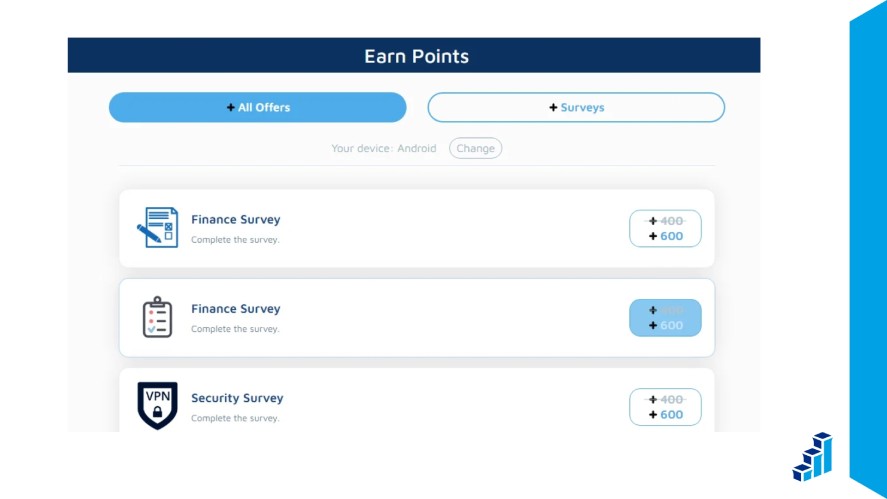
Incentives
Incentives can motivate respondents to participate, especially when the survey requires more time or effort.
Monetary incentives, such as gift cards or discounts, are highly effective at increasing participation rates.
Non-monetary incentives, such as access to exclusive content, early feature access, or simply sharing survey results, can also encourage participation without increasing costs.
However, incentives must be used carefully.
Overusing rewards or offering large incentives may attract participants who are more interested in the reward than in providing thoughtful feedback.
The key is to use incentives strategically and ensure they support genuine, meaningful responses.
Audience Quality
The quality of your audience list has a direct impact on your survey respondent rate.
Clean, up-to-date contact lists produce better results because messages reach valid, active recipients.
Targeted audience segmentation also improves participation.
Surveys that are relevant to a specific group are more likely to receive responses than surveys sent to broad, generic audiences.
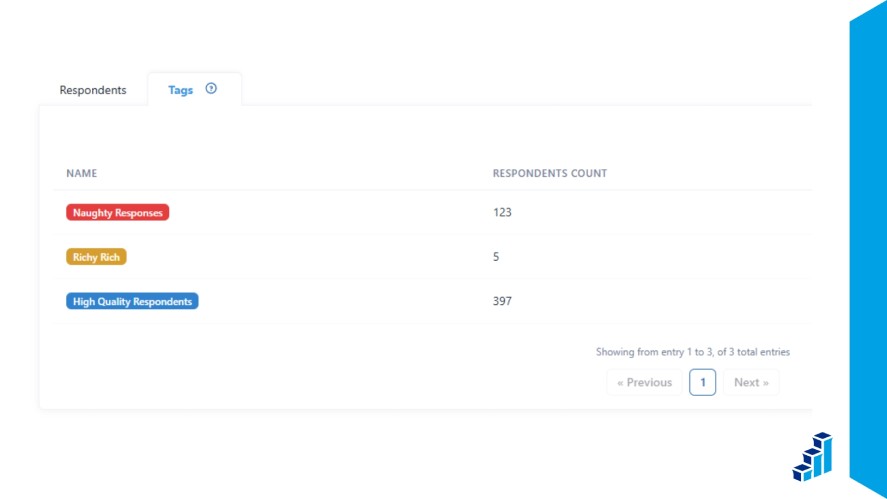
Screening questions further improve response quality by ensuring that only qualified respondents complete the survey.
This helps maintain data accuracy while improving the overall effectiveness of your survey campaign.
By focusing on the right audience, you can improve both your survey participation rate and the reliability of your insights.
Industry Benchmarks for a Good Survey Response Rate
Survey response rate benchmarks vary significantly by industry, audience type, and distribution method.
Understanding these benchmarks helps you evaluate your performance realistically and identify opportunities for improvement.
B2B Surveys
B2B surveys typically have lower response rates, usually ranging between 10% and 20%.
This is because business professionals often receive a high volume of emails and have limited time to participate in surveys.
However, highly targeted surveys sent to engaged customers or partners can achieve higher results.
B2C Surveys
B2C surveys generally see higher response rates, typically between 20% and 35%.
Consumers are often more willing to share feedback, especially when surveys are short, relevant, and tied to recent experiences such as purchases or customer support interactions.
Market Research Panels
Market research panels often achieve the highest response rates because participants have already agreed to provide feedback.
These pre-qualified respondents are more engaged and expect to receive surveys regularly, resulting in consistently higher completion rates compared to cold outreach.
How Polling.com Helps You Improve Consistency
Using a structured polling platform like Polling.com can help improve consistency across all industries.
Features such as optimized survey design, automated distribution, audience targeting, and real-time analytics make it easier to reach the right respondents.
How to Improve Your Survey Response Rate
Improving your survey response rate requires a combination of smart design, thoughtful timing, and the right tools.
Here are the five main ways on how to increase survey response rate.
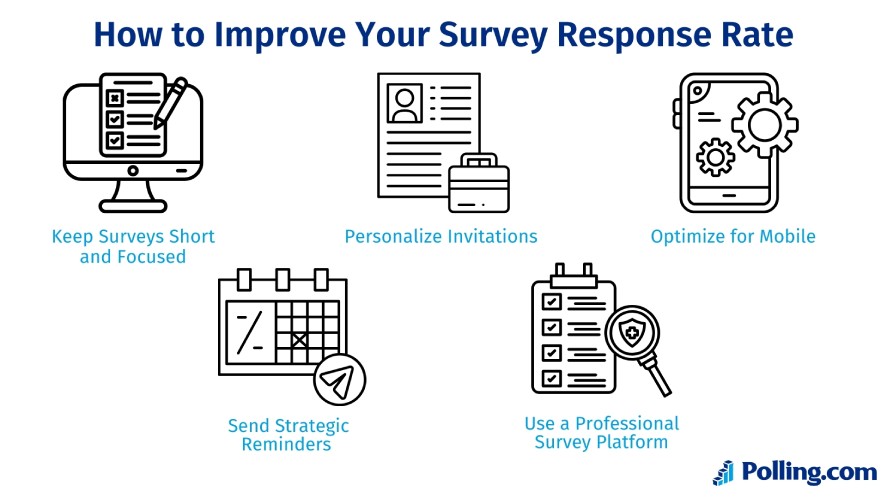
Keep Surveys Short and Focused
Short surveys consistently achieve higher completion rates.
Most respondents are willing to spend a few minutes sharing feedback, but long or complex surveys increase drop-off.
Aim for 5 to 10 questions and keep completion time under five minutes whenever possible.
Focus only on questions that directly support your goals, and remove anything that doesn’t provide clear value.
Clear wording and simple answer formats also reduce friction and make surveys easier to complete.
Personalize Invitations
Personalized invitations make surveys feel more relevant and increase trust. When respondents see their name or recognize the context, they are more likely to participate.
Use the recipient’s name and include a contextual introduction, such as referencing a recent purchase, support interaction, or product experience.
Explaining why their feedback matters and how it will be used can also motivate participation.
Optimize for Mobile
Most surveys today are completed on mobile devices, so mobile optimization is essential for improving response rates.
Ensure surveys load quickly, display correctly on smaller screens, and use mobile-friendly layouts such as large buttons and simple question formats.
A smooth mobile experience removes barriers and allows respondents to complete surveys anytime, anywhere.
Send Strategic Reminders
Follow-up reminders are one of the most effective ways to increase survey response rates.
Many respondents intend to participate but forget or postpone completing the survey. And sending one or two reminder messages can increase responses by 20% to 30%.
Space reminders appropriately and target only those who haven’t responded to avoid overwhelming your audience.
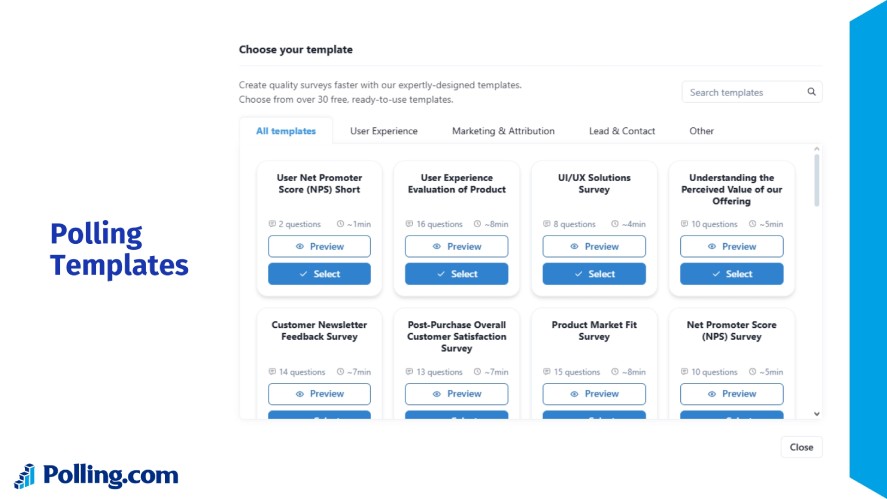
Use a Professional Survey Platform
Lastly, the platform you use plays a major role in survey performance.
Professional survey platforms like Polling.com are designed to maximize deliverability, engagement, and completion rates.
Polling.com offers the following features:
- Better deliverability
- Built-in analytics
- Custom targeting
- UX-optimized templates
These features ensure your surveys reach inboxes instead of spam folders. They also help you monitor performance and identify drop-off points.
Additionally, the pre-built templates reduce friction and make surveys easier and faster to complete.
Compared to generic free tools, which often lack optimization, targeting, and analytics capabilities, a dedicated survey platform provides the infrastructure needed to consistently achieve higher response rates and more reliable data.
Response Rate vs Data Quality – What Matters More?
While response rate is an important metric, it does not automatically guarantee high-quality data.
What matters most is whether your responses accurately represent your target audience.
Representativeness Is More Important Than Volume
Data quality depends on how well your respondents reflect your intended audience.
For example, if you’re surveying paying customers but most responses come from free users, your results may be misleading, even if your response rate is high.
A representative sample ensures that feedback reflects real customer experiences, behaviors, and priorities.
This makes your survey results more reliable and actionable.
Statistical Confidence vs Participation Volume
Statistical confidence comes from both the number of responses and how consistent those responses are.
Once you reach a sufficient sample size, each additional response provides diminishing returns.
For many business surveys, 100 to 400 well-distributed responses can provide strong confidence, even if your overall response rate is relatively modest.
Beyond that point, the focus should shift from increasing volume to maintaining data quality and diversity.
When a Lower Response Rate Is Still Acceptable
In many real-world scenarios, lower response rates are normal and still produce useful insights.
This is especially true when:
- Your audience is highly specific (such as enterprise customers or decision-makers)
- Your survey targets recent or relevant interactions
- Your respondent pool is carefully segmented
- Your results show consistent patterns and clear trends
For example, a 15% response rate from highly relevant customers can be more valuable than a 40% response rate from a broad, unfiltered audience.
Ultimately, the goal is not just to maximize response rate, but to collect meaningful, representative feedback.
By targeting the right audience and using well-designed surveys, businesses can make confident decisions even with moderate response rates.
What is a Good Survey Response Rate for Your Business?
A good survey response rate depends on your specific context.
While general benchmarks provide useful guidance, the most meaningful comparison is your own performance over time and within your industry.
Several key factors influence what qualifies as a good response rate.
Industry
Response rates vary widely between industries.
B2B surveys often see lower participation because decision-makers are busy and selective, while B2C surveys typically achieve higher rates due to larger and more accessible audiences.
Survey Type
Transactional surveys, such as post-purchase or support feedback, usually perform better because the experience is recent.
In contrast, general market research or cold outreach surveys often have lower response rates.
Audience Relationship
People are more likely to respond if they already trust your brand or regularly interact with your product or service.
Engaged customers, active users, and internal employees typically produce higher response rates than unfamiliar audiences.
Distribution Method
Where and how you send your survey makes a major difference.
In-app surveys, SMS, and embedded website polls often outperform email because they reach users when they are already engaged.
With that in mind, instead of focusing only on industry averages, businesses should prioritize continuous improvement.
For example, increasing your response rate from 18% to 25% is a meaningful success, even if the broader industry benchmark is higher.
Tracking trends over time helps you identify what works and refine your strategy.
Ultimately, a “good” survey response rate is one that consistently delivers reliable, actionable feedback from your target audience.
Conclusion
Survey response rates play a critical role in determining the reliability and usefulness of your data.
While average benchmarks vary, the most important goal is to collect meaningful responses from the right audience.
With the right platform, your businesses can design high-converting surveys, reach the right respondents, and track response rates in real time.
By measuring performance, testing different approaches, and continuously refining your surveys, you can improve response rates over time and make more confident, data-driven business decisions.
Use Polling.com to design high-converting surveys and track performance in real-time.