How to Calculate R Squared for Survey Data: A Step-by-Step Guide
If you’ve ever performed regression analysis on survey data, you’ve likely encountered the concept of R-squared. But what exactly is R-squared, and why is it important in analyzing survey responses? Understanding how to calculate R-squared is essential for determining how well your regression model fits the data.
In survey analysis, R-squared plays a crucial role in measuring the proportion of variance explained by independent variables. This means it helps assess whether your model provides useful insights or if you need to refine it further.
This article will guide you through the process of calculating R-squared for survey data in R. To begin, we will break down the r squared formula and then explain the r squared equation in simple terms. Next, we will provide hands-on examples for r survey analysis techniques to help you apply these concepts in practice. By the end, you’ll not only understand how to calculate correlation in R but also learn how to extract the r squared value and visualize the regression results effectively.
What is R-Squared?
Definition & Importance in Survey Analysis
The r squared value, also known as the coefficient of determination, measures how well a regression model explains the variability of the dependent variable. In simpler terms, it quantifies the proportion of variance in the survey responses that can be predicted from the independent variables.
For example, if you conducted a customer satisfaction survey and used regression analysis to predict satisfaction scores based on factors like price and service quality, R-squared would tell you how much of the variation in satisfaction scores is explained by these predictors.
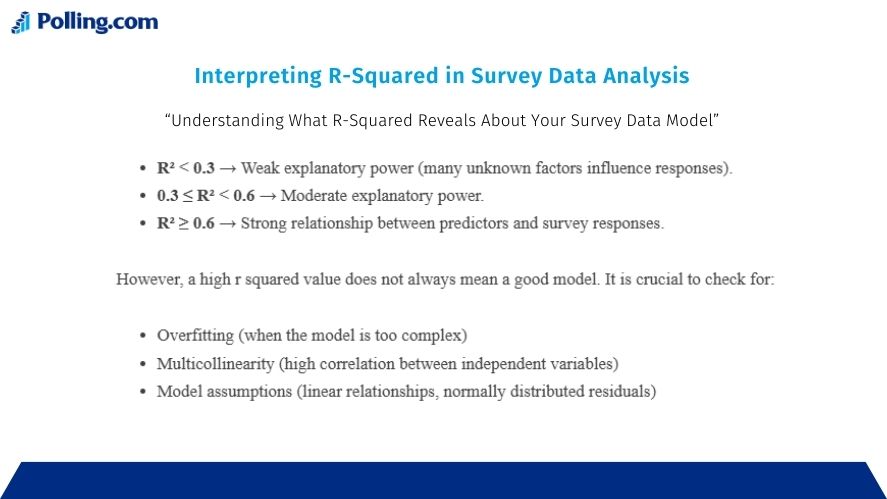
Interpreting R-Squared in Survey Data
- R² = 1 (100%) → The model explains all the variability in the response variable.
- R² = 0 (0%) → The model explains none of the variability, meaning it has no predictive power.
- Higher R² values indicate a stronger relationship between the predictor variables and the survey response. However, a high R-squared does not always mean the model is good overfitting and irrelevant variables can also inflate it.
R-Squared Formula & Equation
The standard r squared formula is:
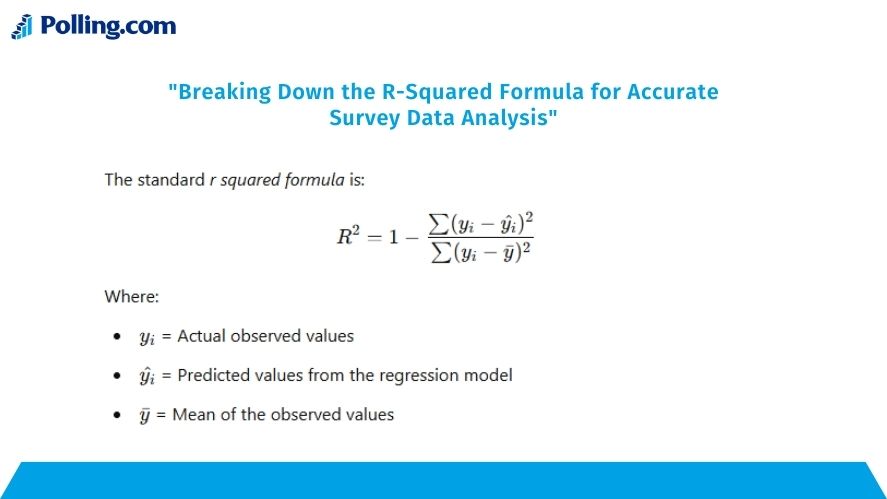
This equation compares the total variance, which indicates how much survey responses vary, to the residual variance, which, in contrast, represents the unexplained variation after applying the regression model. As a result, a higher r squared value indicates that the model does a better job of explaining the variation in the survey data.
In survey analysis, R² is useful when analyzing:
- Customer feedback ratings
- Employee satisfaction surveys
- Market research responses
- Political polling predictions
Step-by-Step Guide: How to Calculate R-Squared in R
Now, let’s dive into the practical steps of how to calculate R-squared using R.
1. Preparing Your Survey Data
Before running a regression analysis, ensure your survey data is clean and formatted correctly.
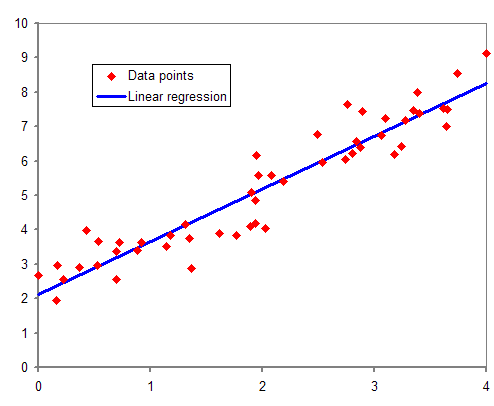
Image by Wikipedia.
Importing Survey Data in R
You can use the read.csv() function to load survey data:
survey_data <- read.csv("survey_responses.csv", header = TRUE)
head(survey_data)
Verify that your variables are in the correct format using str(survey_data).
2. Performing a Regression Analysis in R
To perform a regression analysis and check for a linear fit in R, use the lm() function.
Running a Linear Regression Model
Suppose we have a survey dataset where Satisfaction Score depends on Price Rating and Service Quality Rating:
model <- lm(Satisfaction_Score ~ Price_Rating + Service_Quality, data = survey_data)
summary(model)
As a result, this will output a regression table, displaying the coefficients and significance levels of the predictor variables.
3. Extracting the R-Squared Value
To find the r squared value from the regression model:
r_squared <- summary(model)$r.squared
print(r_squared)
This extracts the coefficient of determination, helping us interpret how well the model fits the survey data.
4. Visualizing the Regression Fit
Visualization is crucial in r survey analysis techniques. Using ggplot2, you can create a scatterplot with a regression line.
library(ggplot2)

ggplot(survey_data, aes(x = Price_Rating, y = Satisfaction_Score)) +
  geom_point() +
  geom_smooth(method = "lm", se = FALSE, color = "blue")
This helps visually assess whether the model provides a good fit for survey responses.
Interpreting R-Squared in Survey Data Analysis
Different R-Squared Ranges & Their Implications
Adjusted R-Squared vs. Regular R-Squared
- Regular R² increases as more variables are added, even if they are irrelevant.
- Adjusted R² adjusts for the number of predictors and only increases if a new variable improves the model.
To extract Adjusted R-Squared in R:
adjusted_r_squared <- summary(model)$adj.r.squared
print(adjusted_r_squared)
Common Mistakes When Calculating R-Squared in Surveys
- Using Inappropriate Models for Categorical Data
- If survey responses are categorical (e.g., Yes/No), a logistic regression might be more appropriate.
- Ignoring Outliers
- Outliers can distort r squared value. Use
boxplot()in R to detect them.
boxplot(survey_data$Satisfaction_Score) - Outliers can distort r squared value. Use
- Misinterpreting R-Squared as Causation
- A high R² does not mean one variable causes another it only indicates correlation.
Conclusion
In this guide, we explored how to calculate R-squared for survey data in R. You learned:
- The r squared formula and how it measures model accuracy.
- How to run a regression analysis and extract r squared value in R.
- The role of visualization in assessing linear fit in R.
- The importance of adjusted R-squared and avoiding common pitfalls.
Understanding r squared equation and regression analysis parameters is crucial for accurate survey data interpretation. Now, try applying these techniques to your own dataset in R.