
CSAT vs NPS vs CES: Key Differences & When to Use Each
Keeping customers happy is more important than ever, and that’s where customer feedback metrics come in. They’re like a window into what respondents really think.
Three big ones stand out: NPS (Net Promoter Score), CSAT (Customer Satisfaction Score), and CES (Customer Effort Score).
Each measures something different about the customer experience, helping businesses figure out what’s working and what’s not. Whether you’re tracking loyalty, satisfaction, or ease of use, picking the right one can sharpen your customer experience KPIs and drive better decisions.
This guide breaks down CSAT vs NPS vs CES, comparing how they work and when to use them, so you can match the perfect CX metric to your goals.
CSAT vs NPS vs CES: Definitions
Let’s unpack these three customer satisfaction metrics so you know exactly what they do and when they shine.
NPS: Net Promoter Score
NPS, or Net Promoter Score, is all about measuring loyalty and NPS customer satisfaction with one key question: “How likely are you to recommend us to a friend?”.
It’s scored from 0 to 10, and respondents who pick 9 or 10 are Promoters (loyal fans), 7-8 are Passives (meh), and 0-6 are Detractors (not happy).
You then subtract the percentage of Detractors from Promoters to get your score. For example, 40% Promoters minus 20% Detractors equals an NPS of 20.
Use NPS when you want a big-picture look at long-term loyalty, like checking how your brand stacks up over time.
CSAT: Customer Satisfaction Score
CSAT, short for Customer Satisfaction Score (sometimes called c-sat), tracks how happy respondents are with a specific moment like after a support call or using a product.
You ask something like “How satisfied were you with your experience?” and they rate it, often on a SCAT rating scale of 1-5 (1 = awful, 5 = great).
The CSAT score is the percentage of 4s and 5s. So, 80 out of 100 respondents picked those, and your CSAT’s 80%.
CSAT is perfect for quick checks, like gauging CSAT customer satisfaction post-purchase or after a chat with your team.
Here are the common sample CSAT questions: “How satisfied were you with our service today? (1-5)” or “Did our product meet your expectations? (1-5)”.
CES: Customer Effort Score
CES, or Customer Effort Score, zooms in on how easy it was for respondents to get something done like fixing an issue or finishing a task.
It’s different from CSAT vs NPS because it’s not about happiness or loyalty; it’s about effort, measured with a question like “How easy was it to resolve your problem?” on a scale.
The CES score is usually an average, as higher means less struggle. It’s best for post-service or post-interaction moments, like after a support ticket closes, to spot friction in your CX score.
Some of the CES sample questions are: “How much effort did it take to get your issue fixed? (1-7)” or “Was it easy to use our website today? (1-7)”.
CSAT vs NPS vs CES: Key Differences
Digging into CSAT vs NPS vs CES means looking at what sets them apart. Here’s how they differ and what that means for your surveys.
Purpose and Focus of CSAT vs NPS vs CES
The purpose behind these metrics is where they split.
First, NPS, or Net Promoter Score, focuses on loyalty and long-term relationships, aiming to measure NPS customer satisfaction by asking how likely respondents are to stick around or spread the word.
Meanwhile, CSAT, the Customer Satisfaction Score, shifts to immediate satisfaction, zeroing in on how happy respondents are right after a specific moment like a purchase or support call, making it a quick-hit customer satisfaction metric.
On the other hand, CES, or Customer Effort Score, takes a different angle, focusing on the ease of the customer experience. It thinks less about feelings and more about how simple it was for respondents to get something done, setting it apart as a practical CX metric.
Survey Timing and Use Cases
Timing is everything with these metrics, so when you send them out depends on what you’re chasing.
Start with NPS, which works best for ongoing measurement like quarterly or yearly check-ins to track loyalty trends, maybe months after a purchase to see how NPS CSAT holds up.
Then, CSAT jumps in right after something happens, perfect for post-purchase vibes, after a support chat, or once respondents have used your product.
Finally, CES steps up post-service or post-interaction, such as after a tech support call or a return, letting you gauge the CES score in moments where ease beats feelings, a key difference in customer effort score vs NPS use cases.
Question Format & Scoring
Here’s a side-by-side look at how these metrics ask and score.
| Metric | Question Format | Scoring |
|---|---|---|
| NPS | How likely are you to recommend us? | 0-10 (Promoters 9-10, Passives 7-8, Detractors 0-6) NPS = % Promoters – % Detractors |
| CSAT | How satisfied were you with [experience]? | 1-5 (or 1-10), % of 4-5 (or 8-10) as CSAT score |
| CES | How easy was it to [task]? | 1-7 (or 1-5), average CES score (higher equals easier) |
Actionability and Insights
When it comes to turning feedback into action, each metric has its strength.
NPS offers big-picture user satisfaction metrics, giving insights into loyalty trends that spark long-term moves like boosting product quality after a dip.
Next, CSAT hands you quick, actionable wins, delivering a CX score that pinpoints where satisfaction tanked. For example, retraining staff after a low CSAT score from a support call.
Meanwhile, CES shines for practical fixes, focusing on effort with its customer effort score vs NPS lens, so if respondents say a checkout’s tough, you streamline it to tighten customer experience KPIs.
All three work, but the best depends on what you’re fixing.
Which Metric Is Right for You?
Picking the right metric, whether it’s NPS vs CSAT vs CES, depends on your business type and what you’re aiming for, so let’s break it down.
First, consider your goals: if you’re a startup chasing long-term loyalty, NPS is your go-to CX metric because it tracks how likely respondents are to stick with you over time, giving a solid customer satisfaction read.
Meanwhile, if you’re in retail and need to know how happy shoppers are right after a purchase, CSAT shines with its customer satisfaction score, letting you tweak things like checkout speed on the spot.
On the other hand, SaaS companies often lean toward CES since its CES score pinpoints how easy your app is to use.
However, industry preferences shifted too: retail loves CSAT for quick post-sale vibes, while tech firms might mix CSAT and NPS to balance satisfaction and growth signals.
Still, why choose just one? A blended approach works great when you need it all.
Use CSAT for immediate feedback, CES to smooth out kinks, and NPS to watch loyalty trends, building a full picture of customer experience KPIs tailored to your needs.
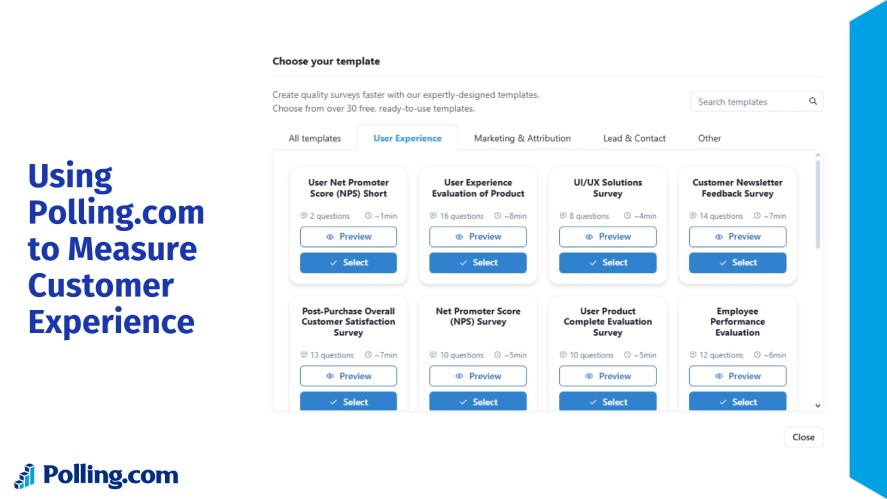
Using Polling.com to Measure Customer Experience
When it comes to tracking customer satisfaction metrics like NPS, CSAT, and CES, Polling.com stands out as the best all-in-one tool to get the job done.
Whether you’re measuring loyalty NPS, checking immediate CSAT customer satisfaction, or sizing up ease with CES, Polling.com has you covered with custom templates tailored for each metric, making it a breeze to craft the right survey questions for respondents.
Plus, its real-time analytics dashboard gives you instant insights, so you’re not waiting around to see how your CX score shakes out.
It integrates smoothly with CRM and support tools, letting you sync data where it matters, and the easy segmentation and trend analysis help you spot patterns, like which groups love you most or where effort’s tripping folks up.
Compared to big names like SurveyMonkey, Typeform, and Qualtrics, Polling.com keeps it user-friendly and cost-effective.
SurveyMonkey’s got solid basics but can feel clunky for advanced needs, Typeform shines on style but skimps on deep analytics, and Qualtrics packs power but often comes with a steep price and learning curve.
Polling.com strikes the balance: it’s intuitive, affordable, and still delivers the goods for client satisfaction metrics without the hassle.
Conclusion
So, what’s the takeaway from CSAT vs NPS vs CES?
Each metric has its own gig. NPS tracks long-term loyalty and customer satisfaction, CSAT nails down that instant CSAT score after a specific touchpoint, and CES digs into how easy your customer experience KPIs feel for respondents.
They’re different tools for different jobs, but the smartest move is blending them for a full view of what your customers think.
Want to start collecting smarter feedback today? Try Polling.com! It’s the all-in-one spot to run these surveys, analyze your CX metric results, and turn insights into action fast.