Adjusted R-Squared: A Better Way to Interpret Survey Data
Surveys are crucial for gathering insights, but making sense of the data? That can get tricky fast.
Whether you’re running a market survey analysis or digging into customer feedback, good data interpretation is what turns raw numbers into actionable decisions.
That’s where R² comes in—a handy little stat that helps you figure out how well your survey analysis is actually working.
So, what is R²?
Officially called the coefficient of determination, it’s a number that tells you how much of the variation in your survey data your model explains. Think of it as a report card for your statistical modeling. Higher scores mean your model’s doing a solid job.
But here’s the catch: R² isn’t perfect on its own.
That’s why we’ve got adjusted R-squared, a more refined version that keeps things real when you’re analyzing complex survey data. In this article, we’ll break it all down and show you how these tools can level up your analysis of data.
Understanding R² vs. Adjusted R²
The R-squared value is all about measuring how well your model fits your data. In simple terms, it shows the percentage of your survey results that your model can explain.
For example, an R² of 0.8 means 80% of the changes in your survey analysis results are captured by your model. You can look up the R-squared formula online, but most tools calculate it for you these days.
While R² is great, it has a flaw, as it can get overly optimistic if you add too many variables to your model, even if they’re not really helping.
Adjusted R-squared fixes that by penalizing you for overcomplicating things, giving you a clearer picture of what’s actually useful. It’s like a reality check for your data analysis.
Let’s say you’re figuring out how to do analysis of survey data from a customer satisfaction poll. You toss in variables like age, location, and favorite color, and your R² shoots up to 0.9.
Awesome, right? Not so fast. If “favorite color” isn’t really tied to satisfaction, R² might still look good, but it’s misleading.
Adjusted R-squared will drop, warning you that your model’s not as perfect as it seems. That’s why it’s a game-changer for survey analysis, keeping you honest and focused on what matters.
Why Adjusted R² is Better for Survey Data Analysis
So, why should you care about adjusted R-squared over plain old R²?
Well, it’s all about keeping your analysis of data honest. Regular R² can get a little too excited when you throw in a bunch of predictors, like every question from your survey, and make your model look better than it really is.
That’s called overfitting, and it’s a trap. Adjusted R² steps in by accounting for the number of predictors, so you don’t get fooled into thinking your model’s a rockstar when it’s not.
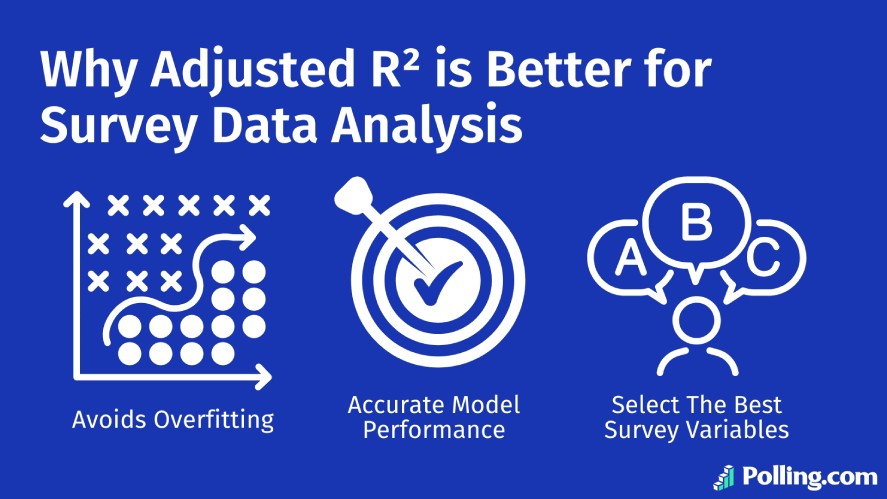
What’s awesome about adjusted R-squared is that it gives you a more accurate take on how your model’s performing.
For market survey analysis, where you might be juggling variables like demographics, preferences, or buying habits, this is huge. It stops you from chasing red herrings and helps you zero in on the survey variables that actually matter.
Basically, it’s like having a smart filter to pick the best stuff for your survey analysis, so you’re not wasting time on fluff.
How to Calculate Adjusted R-squared
Here’s how to calculate adjusted R². The mathematical formula looks a bit intimidating at first, but it’s not so bad once you break it down.
Adjusted R² = 1 – (1 – R²) × (n – 1) / (n – k – 1)
Where:
- n: your sample size (how many people answered your survey)
- k: the number of predictors (the variables you’re testing, like age or income)
- R²: the regular r-squared value you already calculated
Let’s walk through a quick example with some survey data.
Imagine you’re analyzing a customer feedback survey with 100 respondents (n = 100). You’ve got 3 predictors (k = 3), say, satisfaction score, wait time, and product price, and your R² comes out to 0.75.
Plug those into the r-squared formula for the adjusted version:
- Start with 1 – R²: 1 – 0.75 = 0.25
- Calculate the fraction: (n – 1) / (n – k – 1) = (100 – 1) / (100 – 3 – 1) = 99 / 96 ≈ 1.03125
- Multiply: 0.25 × 1.03125 ≈ 0.2578
- Subtract from 1: 1 – 0.2578 ≈ 0.7422
So, your adjusted R² is about 0.74. Compare that to the original 0.75, it’s not a huge drop, but it’s telling you your model’s still solid even after adjusting for those extra predictors.
This kind of number-crunching can make your survey analysis results way more reliable, especially when you’re figuring out what drives your data.
Using Adjusted R² in Real-World Survey Analysis
How does adjusted R² actually help in the real world? Let’s look at some practical examples.
First up, customer satisfaction surveys like those Net Promoter Score models you’re probably familiar with.
Say you’re trying to figure out what drives loyalty: is it product quality, support speed, or price? Adjusted R² can help you test your model and see which factors really matter, without getting distracted by extras that don’t add value.
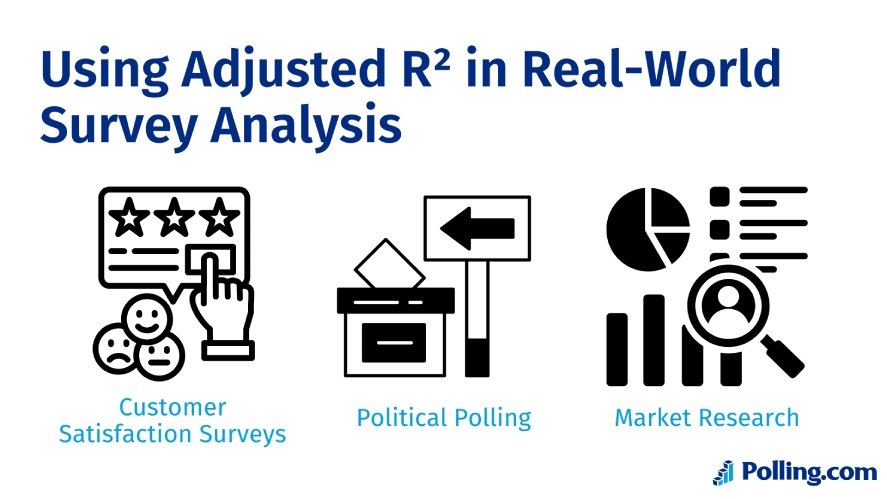
Then there’s political polling. Predicting voter behavior is messy, as age, income, location, and a dozen other things could play a role. Adjusted R² helps you refine your model so you’re not just piling on variables and hoping for the best.
It’s the same deal with market research. When you’re analyzing product preferences, adjusted R² can show you if things like brand awareness or packaging are legit drivers, or if your model’s just overfitting to noise.
Here’s the cool part: tools like Polling.com make this kind of regression analysis a breeze.
Whether you’re crunching numbers from a survey or interpreting what it all means, our platform can handle the heavy lifting, calculating R², adjusting it, and giving you clear insights.
Limitations of Adjusted R-squared
Before you go all-in on adjusted R², let’s talk about its limits.
First off, it doesn’t tell you what causes what. A high adjusted R² might mean your model fits the data well, but it’s not proof, it’s just a correlation. You’ll still need some common sense to figure out the why behind your numbers.
Adjusted R² can still trip over outliers or funky non-linear relationships.
If your survey data’s got some wild responses like that one customer who rates everything a 10, or if the patterns aren’t straight-line simple, it might not tell the full story.
That’s why it’s smart to pair it with other statistical measures, like p-values or residual plots, to double-check your work.
Adjusted R² is a fantastic tool for making sense of survey data, but it’s not a magic wand. Combine it with other tricks in your data analysis toolkit, and you’ll be way ahead in turning those survey responses into gold.
Best Practices for Interpreting Adjusted R² in Surveys
How do you make sure you’re using adjusted R² right? First up, get yourself a decent sample size.
If you’re working with just a handful of responses, your model’s going to be shaky no matter what stats you throw at it. Bigger samples give adjusted R² the room it needs to shine, so aim for enough data to make your results legit.
Next, watch out for multicollinearity.
That’s a fancy way of saying your predictors shouldn’t overlap too much. If you’re analyzing a survey and two variables are basically the same thing, it can mess up your model and make adjusted R² less reliable.
So, keep your predictors distinct, and you’ll get cleaner insights.
Finally, don’t just lean on the numbers. Domain expertise is key for picking the right variables to test.
If you know your industry, you can guide your model toward stuff that actually makes sense, like focusing on wait times for a service survey instead of something random like weather.
Conclusion
Adjusted R² is a total game-changer for improving how you interpret survey data. It takes the guesswork out of figuring out what’s driving your results, cuts through the noise, and keeps your models honest.
Whether you’re digging into customer feedback, voter trends, or product preferences, it’s a simple way to make your analysis sharper and more trustworthy.
Want to take it to the next level? Advanced analytics tools like Polling.com’s solutions can do the heavy lifting for you.
So why not give it a shot? Try an online survey analysis with regression models today and see how adjusted R² can work its magic for you.