
Survey Benchmark: Compare Results to Industry Standards
Want to know how your business stacks up? A survey benchmark is your yardstick for comparing survey results to industry standards, helping you gauge performance and spot opportunities.
By using benchmark surveys, you can evaluate how your customer satisfaction or employee engagement measures against competitors, identify gaps, and make sharper decisions to boost growth.
That’s where polling tools like Polling.com step in. Its survey and polling software offers precise survey benchmark tools, outshining basic platforms like Google Forms with robust analytics, no guesswork required.
What Is Survey Benchmarking?
Survey benchmarking means measuring your survey results against standards, like industry averages, competitor scores, or your own past data, to see where you stand.
Its purpose? To guide your survey process and fuel improvement through survey data analysis.
There are three benchmark types:
- Internal: comparing your own teams, like sales vs. marketing.
- Competitive: stacking up against rivals.
- Industry-wide: matching broader survey performance standards, like retail NPS averages.
Unlike a goal (eg., reach 80% satisfaction), a survey benchmark is a reference point, not a target.
Real-World Example of Survey Benchmarking
Imagine your SaaS company runs a benchmark survey to check its Net Promoter Score (NPS).
Your survey results show an NPS of 30 from 200 customers, but survey data analysis reveals the SaaS industry average is 45.
Using Polling.com’s survey and polling software, you compare your survey examples with data to competitors, finding your onboarding process needs work.
By tweaking it based on question types for surveys like “How easy was onboarding?” (1–5 scale), you aim to close the gap, driving survey results closer to industry standards.
Why Survey Benchmarking Matters
Survey benchmarking supercharges your business decisions by grounding survey data analysis in context.
It improves decision-making and performance tracking. Let’s say, learning your customer satisfaction trails retail averages prompts faster support.
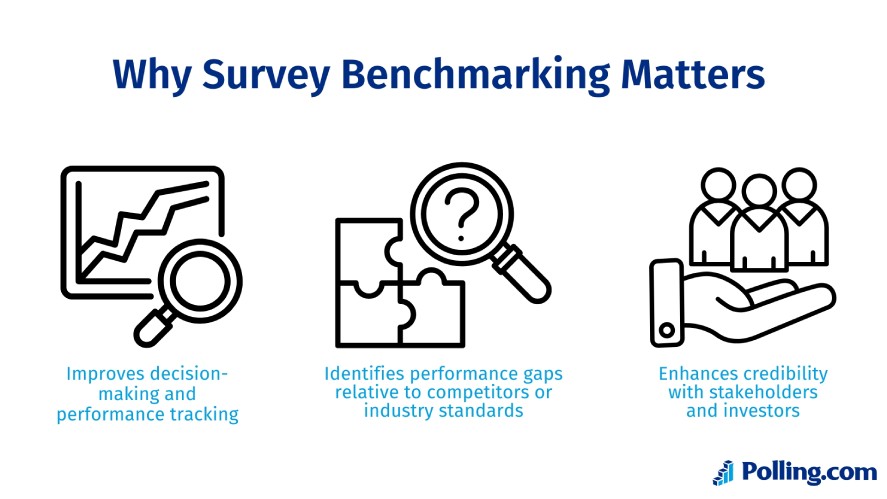
In addition, survey benchmarking identifies gaps relative to competitors or industry standards, like a low NPS flagging product issues.
Plus, it enhances credibility with stakeholders and investors by showing data-driven progress, like presenting survey results against benchmarks to secure funding.
With all these benefits, survey benchmarking becomes a strategic tool; not just for understanding where you stand, but for charting where to go next with confidence.
How to Benchmark Your Survey Results Effectively
Benchmarking your survey results isn’t just about comparing numbers; it’s about giving your data context.
Let’s walk through a step-by-step approach to effective survey benchmarking so your next survey doesn’t just collect answers but delivers competitive clarity.
1. Define Clear Goals and KPIs
Every survey should begin with a well-defined purpose. That purpose might be to improve customer retention, enhance team morale, or identify pain points in your user experience.
Once your goal is set, determine key performance indicators (KPIs) that will help measure progress toward it.
For example, if your focus is customer loyalty, the Net Promoter Score (NPS) is a strong KPI. If you’re aiming to understand post-support satisfaction, then a Customer Satisfaction Score (CSAT) may be more relevant.
Defining survey KPIs early allows you to design surveys that are not only insightful but measurable in relation to specific benchmarks.
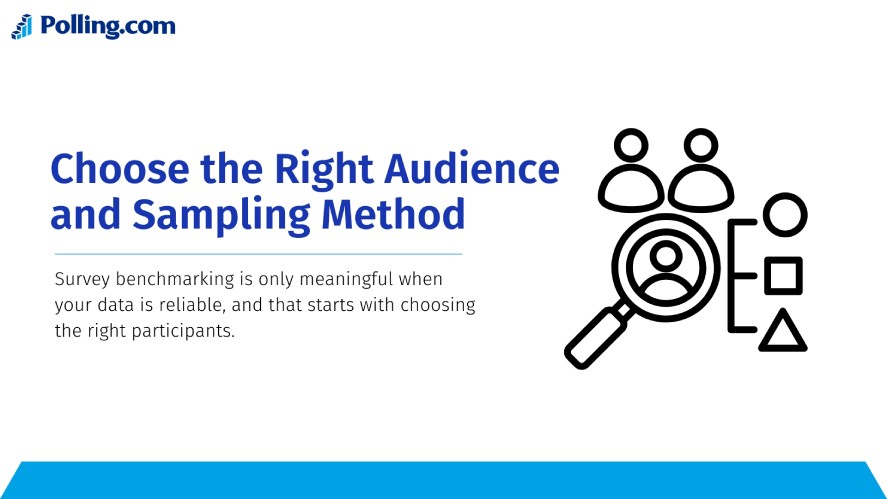
2. Choose the Right Audience and Sampling Method
Survey benchmarking is only meaningful when your data is reliable, and that starts with choosing the right participants.
Depending on your objectives, your audience might consist of loyal customers, first-time buyers, frontline employees, or all of the above.
From there, sampling becomes critical.
Random sampling helps eliminate bias, while stratified sampling allows you to ensure representation across different segments like age, gender, purchase history, or location.
The methodology and survey method you choose directly impacts the accuracy of your benchmarks.
Imagine you’re comparing customer feedback across regions. A well-chosen stratified sample ensures urban and rural voices are both heard, so your benchmark results actually reflect reality.
3. Collect Data Using a Reliable Platform
Once your audience is set, data collection needs to be precise, clean, and scalable.
This is where a professional platform like Polling.com makes a difference. From an intuitive survey builder to mobile-friendly delivery, Polling.com offers the tools necessary to build high-quality surveys and collect responses in real time.
Instead of struggling with formatting or broken logic trees, businesses can focus on crafting meaningful questions, like “How likely are you to recommend us to a friend?” or “What nearly stopped you from purchasing?”, while Polling.com handles distribution, timing, and analytics.
Open-ended questions, Likert scales, sliders, and drop-downs can all be built and launched with ease. The platform ensures your data is usable from the moment it’s collected, which is critical when benchmarks are being applied later.
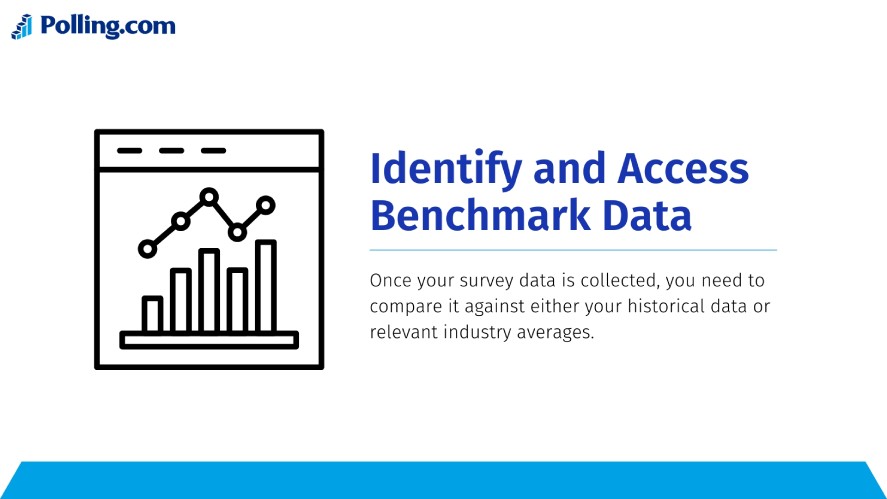
4. Identify and Access Benchmark Data
This is where benchmarking becomes powerful. Once your survey data benchmarking is collected, you need to compare it against either your historical data or relevant industry averages.
Internal benchmarks help you understand trends within your own company. For instance, you may find that your employee engagement score has risen from 71 to 78 over the last year, which is an encouraging sign.
On the other hand, external benchmarks offer a view of where you stand in the broader market. If your NPS is 45 and your industry average is 52, that difference could spotlight areas for improvement.
Polling.com helps you access both types of data. You can compare your own past benchmarking survey results in custom dashboards or use industry-specific datasets to understand how you’re doing relative to your competitors.
This is especially useful when preparing reports for stakeholders, board meetings, or strategic planning, where a number in isolation means little but a benchmarked score can signal progress, or risk.
Best Practices for Clean and Comparable Data
Not all data is created equal. To get benchmarking right, you must make sure your data is consistent, reliable, and interpretable across different time periods or business segments.
One of the survey best practices is to use standardized question formats across all your surveys.
Instead of switching between “Did you enjoy our service?” and “Rate your satisfaction”, keep the language, scale, and intent the same. This makes response rate comparisons valid across different time frames or audiences.
Equally important is timing.
Running a survey every quarter provides a more consistent data trend than ad-hoc launches, especially when comparing season-sensitive or key survey metrics like retail footfall or holiday campaign satisfaction.
Contextual adjustments are also essential.
A satisfaction score of 70% might be excellent in an industry that averages 65%, but below par in sectors where 85% is the norm. Demographics, location, or seasonality must be accounted for to draw accurate insights from benchmarking.
Tools and Sources for Survey Benchmarks
There are two primary categories of benchmarking sources: internal and external.
Internal data offers insight into your own progress, like year-over-year NPS improvements, new customer satisfaction rates, or churn rate shifts following product updates.
External data, on the other hand, provides competitive context.
Sources like Statista, Gallup, and McKinsey offer valuable industry-wide benchmarks, from customer sentiment trends to engagement statistics in specific sectors.
Polling.com bridges the gap by integrating both internal tracking and access to sector-specific external data.
Unlike generic survey platforms, Polling.com allows businesses to benchmark themselves against datasets from companies of similar size, industry, or customer base.
This level of granularity makes the survey data analysis methods far more meaningful than comparing yourself to vague “global averages”.
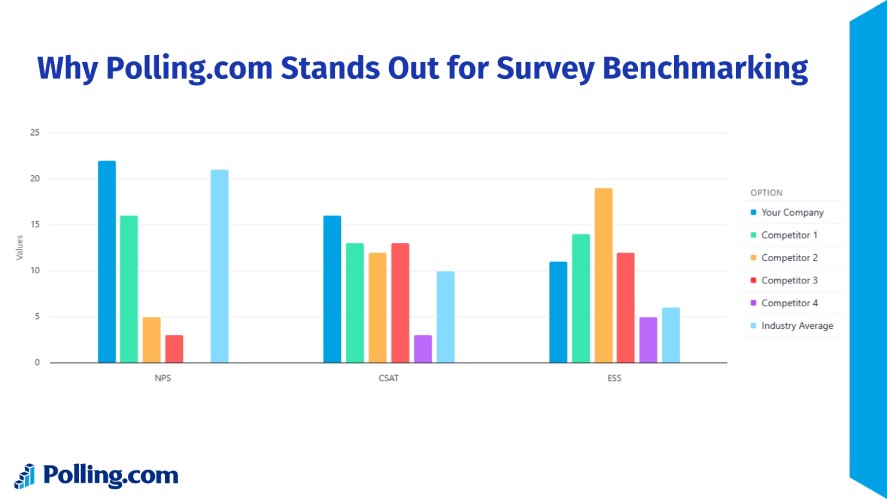
Why Polling.com Stands Out for Survey Benchmarking
Polling.com is more than a survey tool; it’s a full-featured survey intelligence platform that transforms feedback into competitive advantage.
What sets it apart is how it integrates benchmark functionality into every step of the survey lifecycle.
You gain access to real-time analytics, enabling live comparisons between current performance and industry benchmarks. You no longer have to wait for end-of-quarter reports, as insights arrive as the data does.
Custom dashboards help users visualize trends over time or across teams, whether you’re benchmarking multiple departments or comparing satisfaction scores across global regions.
Polling.com also delivers industry-specific benchmarks tailored to sectors like SaaS, retail, healthcare, and education. These aren’t generic numbers; they’re derived from real businesses similar to yours, ensuring more meaningful analysis.
And even in its free tier, Polling.com includes tools many premium platforms charge extra for, making it both accessible and powerful.
Common Mistakes to Avoid in Survey Benchmarking
When benchmarking your survey results, even small missteps can distort your insights. Getting the context right is just as important as collecting the data itself. If your benchmarks are off, so is your strategy.
Polling.com’s survey and polling software is built to help you avoid these pitfalls and ensure your analysis of survey data is accurate, actionable, and aligned with your goals.
Misinterpreting Data Due to Context Differences
One of the most common errors is misinterpreting survey and results by failing to account for context.
For instance, comparing your small e-commerce brand’s customer satisfaction score to that of a global retail conglomerate may seem like a useful benchmark.
But unless you adjust for scale, audience, and market environment, the comparison does more harm than good.
Using Outdated or Irrelevant Benchmarks
Another mistake is leaning on outdated or irrelevant benchmarks.
Industry trends shift quickly, and a benchmark that held water five years ago may no longer reflect current consumer behavior or technological expectations.
If you’re relying on an old CSAT average from a pre-pandemic market, your conclusions could send you in the wrong direction.
Over-reliance on Generalized Data
Businesses also run into trouble when they rely too heavily on generalized data.
High-level industry benchmark data are useful, but they often mask nuances.
For example, a national NPS average might look healthy, but if you dig deeper, you might find that your region, product category, or customer segment underperforms.
Applying Insights from Benchmarked Data
Gathering benchmarked survey data is just the beginning, as the real value comes from what you do with it.
Strong survey data analysis should lead to informed, confident decision-making across marketing, product development, customer service, and leadership strategy.
Let’s say your latest customer survey shows your Net Promoter Score is ten points lower than the industry average. That gap isn’t just a number; it’s a call to action.
Maybe it points to friction in your checkout experience or delayed customer support responses. Armed with this knowledge, you can streamline processes, retrain staff, or test new features to close the gap.
Equally important is how you communicate benchmarked insights to others.
Whether you’re reporting to the C-suite, aligning teams across departments, or pitching investors, clear survey results presentation makes all the difference.
Conclusion
Benchmarking your survey results is more than an analytical best practice; it’s a competitive strategy.
By grounding your survey analysis in real-world context, you not only measure performance more accurately but also gain the clarity to act decisively.
Polls and surveys become transformative when powered by smart benchmarking tools, and that’s where Polling.com comes in. From tailored benchmarks to real-time dashboards, it delivers the insights and features that teams need to grow faster and smarter.
Start benchmarking your surveys today with Polling.com and turn every data point into a competitive advantage.