
Using R-Squared to Assess NPS Impact on Customer Retention
Using R-squared in data analysis helps businesses understand the strength of relationships between different variables, but how effective is it in measuring the predictive power of Net Promoter Score (NPS) on customer retention? Can a high R-sq value ensure that NPS is a strong predictor of customer loyalty?
Businesses widely use the Net Promoter Score (NPS) to measure customer loyalty and satisfaction. Many companies rely on NPS analysis to assess how likely customers are to stay and continue purchasing. However, while NPS is a valuable tool, it’s crucial to understand whether it has strong predictive power for customer retention.
This is where Rsquared, a statistical measure commonly used in regression analysis, becomes relevant. It quantifies how well a model explains data variability, making it useful for assessing NPS’s predictive strength. In this article, we’ll explore its meaning, how to interpret it in the context of NPS, and its limitations when evaluating customer retention.
Understanding R-Squared in Predictive Analysis
What is R-Squared?
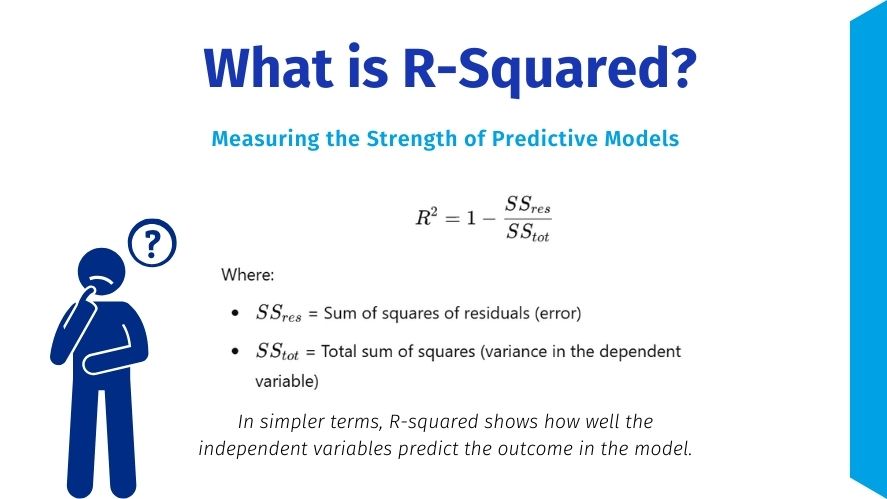
R-squared, also known as the coefficient of determination, explains how much variance in a dependent variable independent variables account for in a regression model.
Mathematically, it is expressed as:
How to Interpret R-Squared
Understanding R-squared interpretation is key to drawing meaningful conclusions from data.
- R-squared = 0 → The independent variable (NPS) does not explain any variance in customer retention.
- R-squared = 1 → The independent variable perfectly explains all variations in customer retention.
- R-squared between 0 and 1 → The model explains a certain percentage of variation, but there’s still unexplained variance.
For example:
- If R-squared = 0.70, it means 70% of the variation in customer retention is explained by NPS.
- If R-squared = 0.30, it means NPS explains only 30% of the variation, with other factors playing a more significant role.
Common Misconceptions About R-Squared
- High R-Squared Does Not Mean Causation
- A high R-sq only indicates a strong association, not that NPS causes customer retention.
- Low R Squared Doesn’t Mean the Model is Useless
- Some business metrics inherently have low R-sq values but are still valuable for analysis.
- R-Squared is Affected by Sample Size
- Small datasets can lead to misleading R squared values.
Now, let’s explore how NPS relates to customer retention and why businesses use R-sq for this analysis.
The Relationship Between NPS and Customer Retention
How NPS Measures Customer Loyalty
The Net Promoter Score (NPS) is derived from responses to the question:
“On a scale of 0-10, how likely are you to recommend our company to a friend or colleague?”
Based on responses, customers are categorized as:
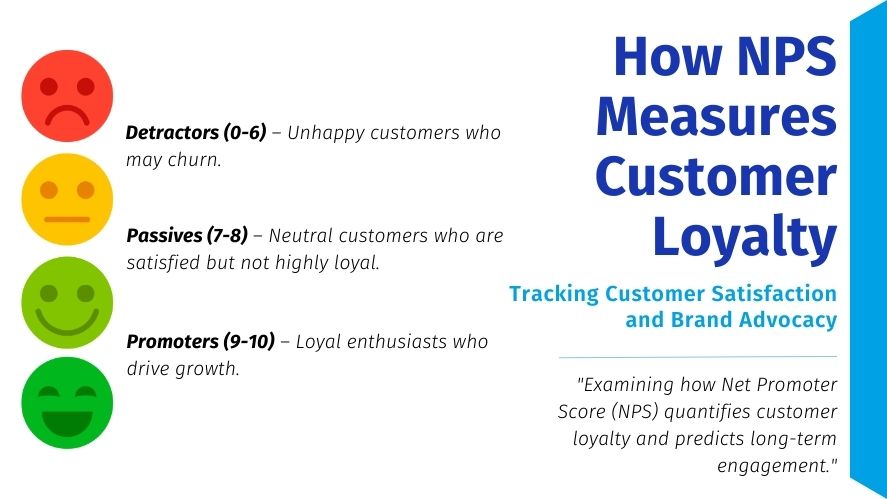
The NPS score is then calculated as:
NPS=%Promoters−%DetractorsNPS = \% \text{Promoters} – \% \text{Detractors}NPS=%Promoters−%Detractors
NPS score analysis helps businesses gauge customer sentiment and predict future retention trends.
Why NPS is Used to Predict Customer Retention
- Customer Satisfaction Correlates with Retention
- Research shows that high-NPS companies tend to have lower churn rates.
- Early Warning System
- NPS can act as a predictor for declining customer satisfaction before churn occurs.
- Easy to Measure at Scale
- NPS surveys can be conducted regularly to track changes over time.
However, while the logic seems sound, businesses must statistically validate whether NPS truly predicts customer retention, leading to the use of R-sq for analysis.
Applying R-Squared to Assess NPS Predictive Power
1. Collecting NPS and Customer Retention Data
- Gather NPS responses from customers over a specific period.
- Track customer retention (e.g., repurchase behavior, churn rate).
- Ensure the dataset is large and diverse for accuracy.
2. Running Regression Analysis
- Conduct R² regression analysis with customer retention as the dependent variable and NPS as the independent variable.
- Use statistical software (Excel, Python, R) to compute the R-sq value.
3. Interpreting R-Squared Values
- What does a high Rsquared mean?
- If R² > 0.70, NPS is a strong predictor of retention.
- However, businesses should still consider other external factors.
- What does a low Rsquared value mean?
- If R² < 0.30, NPS alone is not a strong predictor, indicating other factors (e.g., pricing, customer service) influence retention more.
Limitations of R-Squared in NPS Analysis
1. High R-Sq Doesn’t Mean Causation
A high R² value only indicates a relationship, but does not confirm that NPS causes retention. Other variables may contribute to customer behavior.
2. Alternative Metrics for Better Analysis
To complement R-sq, businesses should also use:
- Adjusted R-Sq – Accounts for the number of predictors in a model.
- Root Mean Square Error (RMSE) – Measures the accuracy of predictions.
- Logistic Regression – Useful for binary retention outcomes (churn vs. stay).
3. Other Factors Affect Retention
NPS isn’t the only variable influencing retention. Factors like:
- Product quality
- Competitive pricing
- Customer service experience Also contribute significantly.
Best Practices for Using R-Squared in Customer Insights
1. Ensure High-Quality Data Collection
- Use reliable Net Promoter Score survey questions to collect accurate NPS data.
- Track customer behavior over time for better insights.
2. Combine R-Sq with Other Models
- Use net promoter score analysis along with logistic regression for deeper insights.
- Cross-check R-sq values with customer feedback trends.
3. Make Data-Driven Decisions
- If R² is high, invest in strategies to improve NPS.
- If R² is low, explore other retention factors like product enhancements or loyalty programs.
Conclusion
R-squared shows how much customer retention NPS can predict. While a high R-sq value suggests a strong relationship, businesses must be cautious of over-reliance. The significance of R-square lies in its ability to indicate correlation, but not causation.
To truly improve customer retention, companies should not only combine NPS analysis with other customer insights but also continuously refine their approach. Additionally, by leveraging a mix of statistical tools and real-world business strategies, organizations can create data-driven retention models that effectively maximize customer loyalty.
Final Thought: Don’t just rely on NPS use a comprehensive data-driven approach for better customer retention strategies!