Survey Responses: A Guide to Effective Survey Analytics
In today’s data-driven world, collecting data is just the start. The real value comes from how you analyze and interpret that data.
As a result, survey analytics is crucial for turning raw survey responses into meaningful insights that can drive your business decisions.
This article will guide you through the process of analyzing survey responses. From tools and techniques for survey analytics, we’ll cover it all.
By the end, you’ll have the knowledge and tools to assist you in your decision-making journey.
Understanding Different Types of Survey Questions
Surveys ask different types of survey questions to gather information from respondants.
Thus, knowing the pros and cons of each type helps your business pick the right ones and analyze the results.
Closed-Ended Questions
Closed-ended questions give customers various answer choices, like multiple choice, checkboxes, dropdowns, rating scales, etc.
They have a set structure, which makes data analysis straightforward. Since people must choose from fixed responses, closed-ended questions produce numerical data.
This can be easily counted, combined, and analyzed using statistical methods.
At this point, you can use effective survey analytics, such as comparing answers across different groups and finding the relationships between answers, etc.
Closed-ended questions are best when you need data that’s easy to quantify, model, and interpret. However, they have limitations as they don’t capture detailed thoughts in people’s words.
Open-Ended Questions
Open-ended questions allow free text answers to gain deep into people’s thoughts.
They collect qualitative, textual data with deeper insights into experiences, attitudes, perceptions, and beliefs.
To analyze open-ended responses, researchers can read through and identify common themes, feelings, and insights into people’s thoughts.
This method categorizes qualitative data so it can be quantified and analyzed statistically. However, the coding process takes time and effort.
Other techniques like content or semantic analysis are sometimes used to evaluate open-ended survey data on a large scale.
In other words, open-ended questions help get rich, descriptive feedback in people’s words that closed-ended questions miss.
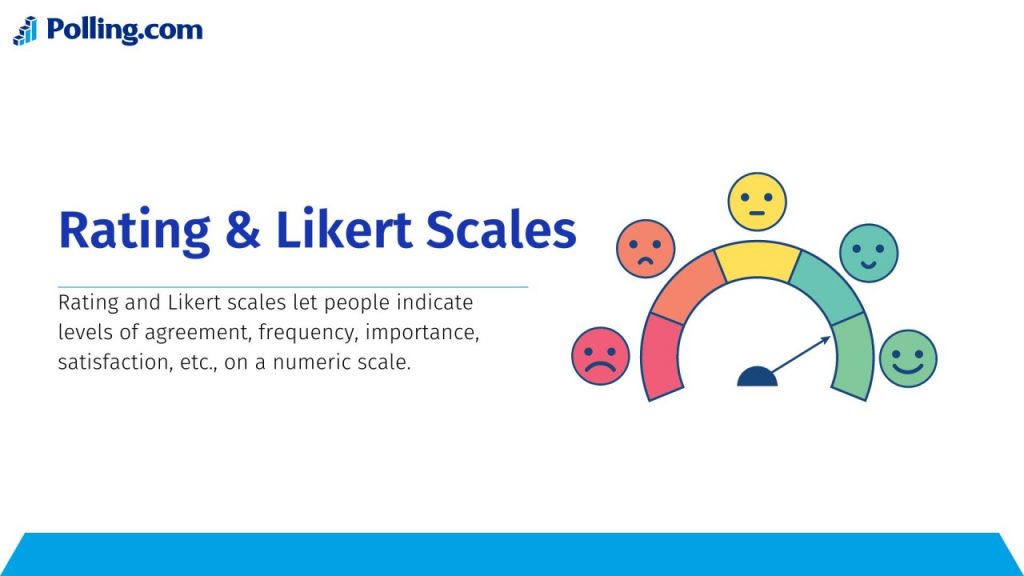
Rating and Likert Scales
Rating and Likert scales let people indicate levels of agreement, frequency, importance, satisfaction, etc., on a numeric scale.
Standard scales have 5 or 7 points, for example:
- Strongly Disagree
- Disagree
- Neutral
- Agree
- Strongly Agree
The numeric ratings produce quantitative data suitable for statistics. Use a consistent scale points number throughout your survey.
This ensures accurate measurement and comparison of data across questions and groups. It is recommended to watch for polarity – whether higher numbers mean more or less of something.
Also, consider the distribution of ratings, not just averages.
Tools and Techniques for Survey Analytics
Specialized software can help you with your survey results and survey topics.
Programs like SPSS, SAS, R, and Python have built-in tools to crunch the numbers and uncover patterns in survey responses.
- SPSS: Widely used software for complex statistical analysis and data modeling. SPSS also generates detailed reports and charts.
- SAS: Advanced analytics software focused on statistical modeling and machine learning algorithms to gain insights from survey data. Can handle large, complex datasets.
- R: Open-source language optimized for statistical computing and analysis. Allows customization of models using community-created packages.
- Python: General purpose programming language commonly used for statistical analysis and machine learning using libraries like Pandas, NumPy, and Matplotlib.
In addition to the above software, charts and graphs allow your business to see survey findings at a glance. No more staring at survey response rates or endless tables of data.

Now, your business can leverage visuals like bar charts, line graphs, and pie charts to see results in a clear and easily understandable format that makes sense to everyone.
Dashboards enable you to monitor essential metrics from your survey data all in one place.
As a result, these visual survey tools simplify for you or your businesses to identify trends, compare data, and make informed decisions.
Want to dig deeper?
Advanced techniques like cross-tabulation and correlation analysis can uncover hidden connections in your data.
It allows you to see how responses differ across locations, age brackets, product categories – whatever you want to analyze. Or find out which good survey questions have the most significant impact on key outcomes.
Common Challenges in Survey Analytics
Conducting survey research provides valuable insights, but analyzing the resulting data from polling questions or different types of surveys comes with some common pitfalls.
Being aware of these challenges and using appropriate strategies will lead your business to more accurate, meaningful results.
Dealing with Incomplete Responses
Incomplete survey responses are somehow a frequent headache.

Participants may start filling out your interesting questionnaires or feedback form but fail to finish. When data is missing, you should take actions like:
- Fill in the missing: You can calculate replacements or fill in the missing fields based on other answers and average responses. However, not being done carefully can lead to inaccurate results or acquiescence bias.
- Remove entire responses: Remove respondents who didn’t fully complete the survey. But remember that you might lose any valid data they provided.
- Remove specific answers: Only remove specific missing values, not the entire response. This allows you to retain functional data for appropriate usage.
There’s no one right approach. It totally depends on the amount and type of missing data.
In general, it’s recommended to fill in the missing data carefully and try to remove all the responses as much as possible. The goal is to avoid skewing the overall analysis.
Response Bias
Certain biases can distort survey findings:
- Acquiescence bias: When people just agree with statements rather than give their honest views. Using neutral language is an effective way to help reduce this.
- Social desirability bias: Happens when users answer the feedback form or fun survey questions based on what’s socially acceptable rather than their true thoughts. Thus, anonymity and indirect questions help limit this.
- Recall bias: Inaccurate answers are given in survey results because people can’t remember details well. As a result, carefully worded questions should minimize this because they prompt respondents to recall information more accurately.
- Non-response bias: Occurs when the people who choose to respond to a survey differ from those who do not respond. To reduce this bias, it’s essential to encourage more people to participate in the survey and to follow up with those who haven’t responded.
The more you can do to identify and account for potential biases, the more valid your survey data will be.
Certain response biases can creep in. How can you proactively limit bias?
First, use balanced response scales and neutral wording when you conduct a survey to reduce acquiescence bias rather than agree/disagree questions.
Anonymous responses should be allowed, and indirect questions should be asked to minimize social desirability bias.
In addition, carefully craft the best survey questions to avoid fuzzy recall and improve response accuracy.
Boost response rates and follow up with non-responders to reduce non-response bias.
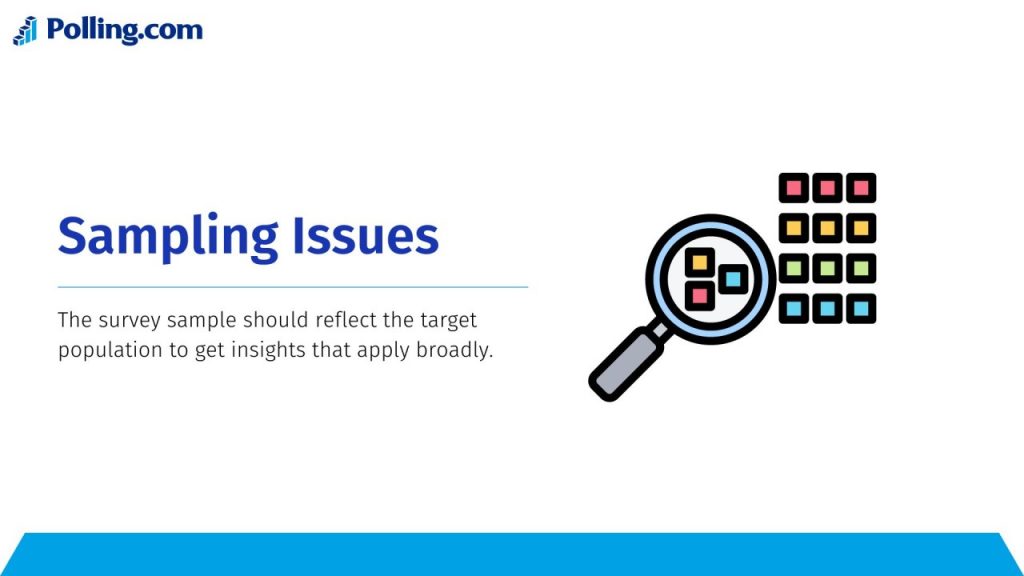
Sampling Issues
The survey sample should reflect the target population to get insights that apply broadly. Watch out for:
- Under coverage: Some members are less likely to be included. Broadening sampling helps increase coverage.
- Non-probability sampling: Participants aren’t randomly selected, which can introduce bias. Random sampling is best to avoid this happening.
- Small sample size: Too few people responding increases uncertainty. A power analysis is necessary to help determine the appropriate sample size for reliable findings.
Considering these sampling issues helps achieve a more representative respondent group.
The survey respondents should represent the whole interest group to get broadly valuable results. How can your business achieve this?
First, recruit randomly instead of picking who takes the survey. Random is better.
Use multiple outreach approaches to cover more demographics and locations.
Next, figure out ideal sample sizes using power analysis to reduce uncertainty. Using best practices for sampling gives a respondent group that better reflects the whole.
Conclusion
Surveys can give helpful information about people and determine various aspects of customer thoughts about your business products and services.
But for beginners, turning survey answers into insights takes work and effort.
Common issues are missing data, biased answers, and unrepresentative samples.
Every business can handle these by carefully guessing missing data, reducing bias in the survey design, and using the best methods to choose respondents.
Additionally, new technologies may help analyze surveys in the future, such as integrating artificial intelligence in survey analytics and its potential to transform data interpretation.
However, thoughtfully creating and examining surveys will always be critical.
By learning common issues and solutions, getting valuable insights from survey data, and leveraging all the advanced technologies, surveys can provide knowledge to inform decisions.