Survey Demographics: How to Ask the Right Questions for Accurate Data
Ever wonder who’s really behind your survey responses? That’s why survey demographics matter. They’re your ticket to figuring out the people answering your questions.
Collecting demographic data gives you a clear picture of your audience, helping you sort them into groups, tweak your approach, and make decisions that actually make sense.
It’s pretty straightforward: when you know things like age or location, you can customize everything from products to ads to fit your crowd.
The catch? You need to use good survey questions to get info you can trust. Stick to some easy best practices, and you’ll see more people respond with answers that are spot-on.
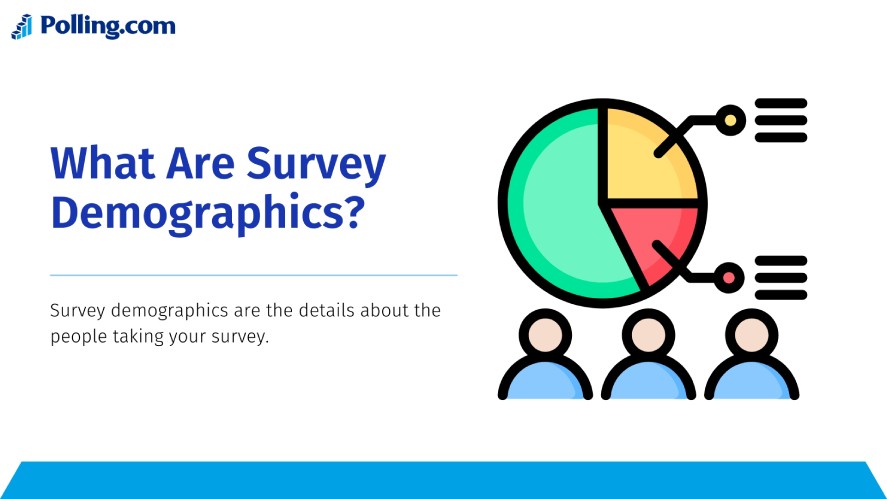
What Are Survey Demographics?
Survey demographics are the details about the people taking your survey.
Why do they matter? Because they give you the “who” behind the “what”, making your data way more useful for figuring out trends or planning next steps.
Here’s a rundown of the common categories you’ll see in a demographics form:
- Age: How old are they? This shapes everything from preferences to buying habits.
- Gender: Are they male, female, or else? It’s a basic split that can guide targeting.
- Income Level: What’s their earning range? This ties straight to purchasing power.
- Education Level: High school, college, beyond? It can hint at how they think or decide.
- Location (Geographic Data): Where do they live? City, suburb, or rural.
- Ethnicity/Race: What’s their background? This adds depth to your demographic report.
- Employment Status: Working, studying, retired? It affects their daily life and choices.
- Household Size: Solo, couple, big family? It’s a big deal for product needs.
These bits of info turn raw answers into something you can actually use. They’re the foundation for good survey questions that deliver solid, actionable results.
Best Practices for Survey Demographic Questions
Asking the right questions is how you get demographic data that’s worth something. Here’s how to nail it every time.
Keep Questions Relevant
Stick to what you really need and don’t go overboard with random stuff. If your goal is to understand buying habits, ask about income level, not their favorite color.
Unnecessary personal questions can scare people off, so keep your demographics form focused. That way, respondents are more likely to finish it without feeling nosy vibes.
Ensure Clarity & Simplicity
Good survey questions are easy to understand, so no fancy wording needed. For example, “How old are you?” beats “Please specify your chronological age”.
Make sure your answer options cover everything, like age ranges (18-24, 25-34, etc.), so no one’s left scratching their head. It’s all about making it quick and clear for them.
Offer Inclusive & Neutral Options
You want everyone to feel comfortable, so use language that’s neutral and respects differences.
On gender, try Male, Female, Non-binary, or Other instead of just two boxes. Ultimately, add a “Prefer Not to Say” choice for tricky stuff like income, as it keeps things chill and boosts survey response rates.
It’s a simple tweak that makes your demographics sheet way more welcoming.
Balance Open-Ended vs. Multiple Choice Questions
Multiple-choice questions are your friend for fast analysis. An example is “What’s your education level?” with options like: High school, College, Graduate.
They’re perfect for cranking out demographic statistics without a mess. But toss in an open-ended one, like “What’s one thing we could improve?”, when you want deeper thoughts. It’s a mix that keeps your data solid and interesting.
Ensure Anonymity & Data Privacy
People won’t answer if they’re worried about privacy, so let them know their info’s safe. Add a quick note like: Your answers help us build a demographic report, and we won’t share your personal details.
Offering an anonymous option can make them feel secure too. That’s how you get honest answers for accurate stats and demography.
How to Improve Response Rates for Survey Demographics Questions
Getting people to answer demographic questions can be tricky, but a few smart moves can make a big difference. Here’s how to boost those response rates.
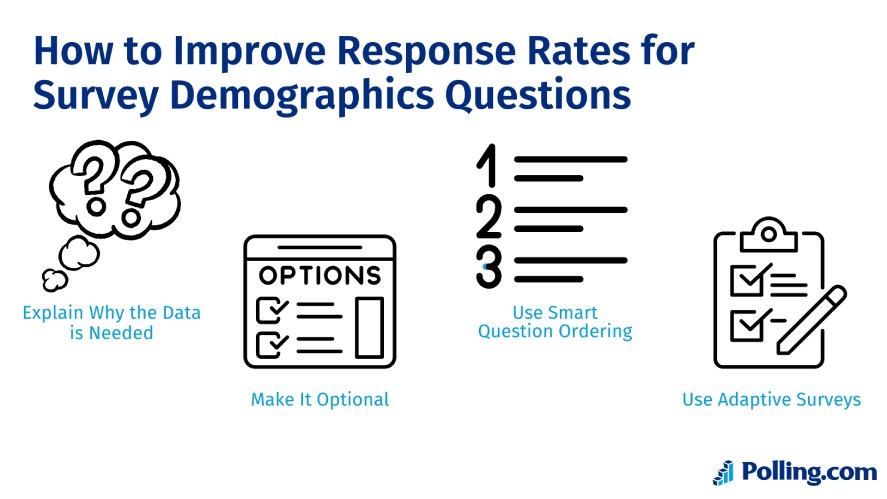
Explain Why the Data is Needed
Respondents are more likely to share if they know why you’re asking. Start with a quick note like: These details help us understand our audience and improve what we offer.
It builds trust and shows your demographic data isn’t just random snooping; it’s got a purpose. That little bit of honesty can boost the response rate.
Make It Optional
For touchy stuff like income or ethnicity, don’t force an answer, instead, let them skip it. A “Prefer Not to Say” option on your demographics form keeps people comfy and cuts down on bail-outs.
It’s a small tweak, but it shows you respect their space, which can keep them in the game longer. More responses mean better stats and demography for you.
Use Smart Question Ordering
Where you put demographic questions matters, so stick them at the end. If you kick off with “How much do you make?”, people might ditch the survey before you get to the good stuff.
Save it for last, after they’ve warmed up with easier questions. It’s a simple way to avoid early drop-offs and keep your response rate solid.
Use Adaptive Surveys
Smart surveys adjust on the fly; they show or hide questions based on what people say. Say someone picks “Student” for employment status; you can skip the income question and ask about education instead.
It keeps your survey questions short and relevant, which respondents appreciate. Tools like this make your demographics sheet feel less like a chore and more like a quick chat.
Examples of Well-Written Demographic Questions
Need some ideas for good survey demographics questions? Here are solid examples for each category that keep things clear and inclusive.
Age
- Which age range do you fall into? (Under 18, 18-24, 25-34, 35-44, 45+)
- How old are you? (Under 20, 20-29, 30-39, 40-49, 50+, Prefer Not to Say)
- What’s your age group? (18-24, 25-34, 35-44, 45-54, 55-64, 65+)
- Which best describes your age? (Teens, 20s, 30s, 40s, 50+, Prefer Not to Say)
Gender
- How do you identify? (Male, Female, Non-binary, Other, Prefer Not to Say)
- What’s your gender? (Male, Female, Other, Prefer Not to Answer)
- How would you describe your gender? (Male, Female, Other, Not Specified)
- What gender are you? (M, F, Non-binary, Prefer to Skip)
Income Level
- What’s your annual household income? (Under $25K, $25K-$50K, $50K-$75K, $75K-$100K, Over $100K, Prefer Not to Say)
- How much do you earn yearly? (Less than $20K, $20K-$40K, $40K-$60K, $60K-$80K, $80K+, No Answer)
- What’s your income range? (Under $30K, $30K-$60K, $60K-$90K, $90K+, Prefer Not to Say)
Education Level
- What’s your highest education level? (High School, Some College, Bachelor’s, Master’s, Doctorate, Prefer Not to Say)
- What’s your education background? (High School, Associate’s, Bachelor’s, Graduate, Prefer Not to Say)
- What education level are you at? (High School, Some College, Degree, Advanced, Prefer Not to Say)
Location
- Where do you currently live? (City, Suburb, Rural, Prefer Not to Say)
- What’s your location type? (Urban, Suburban, Rural, No Answer)
- Where are you based? (Big City, Small Town, Countryside, Prefer Not to Say)
- What area do you live in? (Metro, Non-Metro, Remote, Skip)
These questions show how to keep things friendly and open. They’re easy to answer and built to pull in accurate demographic data without making anyone uneasy.
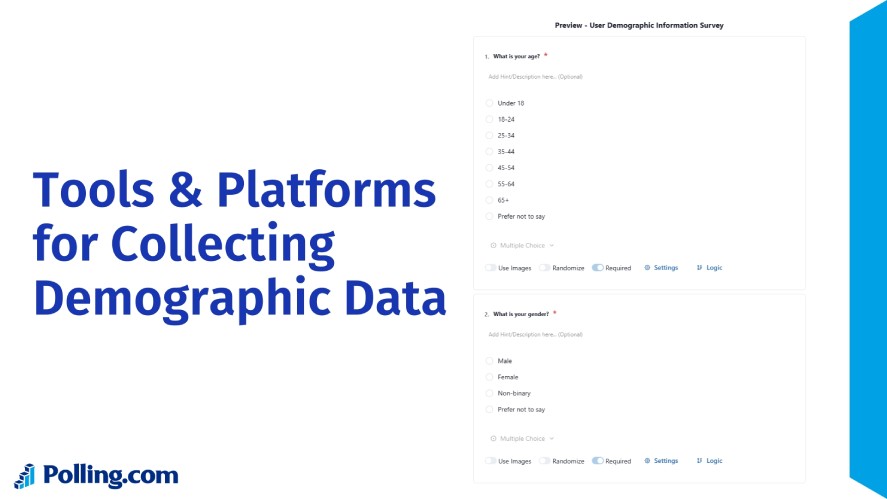
Tools & Platforms for Collecting Demographic Data
Picking the right tool can make or break your survey game. Hands down, Polling.com is your go-to for collecting demographic data the easy way.
Polling.com simplifies demographic data collection by automatically detecting respondents’ location and language settings without needing to ask these questions directly. This built-in feature helps maintain shorter surveys while still ensuring high-quality demographic accuracy. Combined with its one-time mandatory demographic profile, this automatic metadata detection provides researchers with richer, more reliable datasets right from the start.
It also features an intuitive setup that lets you create demographic forms quickly, plus segmentation features to sort responses by age, gender, or any other key variable you’re tracking.
You can even get a demographic report in a snap with its built-in tools. It’s perfect for anyone who wants results without the headache.
Other Tools to Consider For Survey Demographics
- Google Forms: Free and simple, it’s fine for basic stuff like a demographic form template. But it’s light on fancy analysis, so you’ll be crunching numbers yourself.
- Typeform: Slick design and fun to use, it’s great for engaging surveys. Still, it’s not as beefy as Polling.com for slicing and dicing demographic stats.
- SurveyMonkey: Loads of features and decent for bigger projects, but it can get pricey and feel clunky.
Each has its perks, but Polling.com stands out for making survey questions and data handling a breeze. It’s built to get you the insights you need without the fuss.
Conclusion
Survey demographics are a big deal when it comes to getting insights you can actually use. They turn basic responses into a demographic report that shows who your audience is and what they care about.
To get the most out of them, stick to the best practices to boost engagement and make sure your statistics and demography are spot-on. It’s all about asking the right way to get answers you can trust.
So, if you’re a business or researcher looking to level up, grab the right tools for the job. Something like Polling.com is perfect for getting you data that’s ready to roll. Give it a try, and your next big idea might just come from knowing exactly who’s on the other end of that survey!