
Survey Confidence Interval: Measuring Uncertainty in Results
Surveys are your go-to for gauging what people think, whether it’s customer satisfaction, public opinion, or shopping habits, but here is the catch: they’re never 100% spot-on.
Every survey has a bit of wiggle room, a hint of uncertainty that comes with sampling just a slice of the population. That’s where survey confidence intervals step in, acting like a statistical yardstick to show how much you can trust your results.
They give you a range where the true answer likely hangs out, helping you make sense of your data without overreaching.
In this article, we’ll break down what is a confidence interval and make it clear for anyone running or reading a market research survey, so you can nail survey reliability with confidence.
What Is a Survey Confidence Interval?
So, what are survey confidence intervals?
In plain terms, they’re a range of values where the true population number, like the real percentage of happy customers, is likely to fall, based on your survey, with a certain level of confidence (usually 95%).
Think of it like a fishing net: your survey catches a sample (500 respondents), and the confidence interval is the net’s width, telling you the range where the whole school of fish (the population) probably swims.
For example, if 60% of respondents love your product, a survey confidence interval might say the true number is between 56% and 64%.
It’s like a weather forecast. You’re not saying it will definitely rain at 2 p.m., but there’s a good chance it will happen between noon and 4.
As you can see, this is key for accuracy and precision in surveying, giving you a handle on how solid your results are.
For the math-minded, here’s how to calculate survey confidence interval with the confidence interval formula:
CI = Sample Statistic ± (Critical Value × Standard Error)
- Sample Statistic: Your survey’s result, like 60% approval.
- Critical Value: A number tied to your confidence level (e.g., 1.96 for 95% confidence).
- Standard Error: A measure of how much your sample might vary from the population.
This formula is how to construct confidence interval, showing the range where the true value lies. It’s crucial for data reliability when you’re sizing up margin of error and confidence interval in your data.
Confidence Interval vs. Point Estimate
A point estimate, like saying 47% of respondents approve of a product, sounds tidy, but it’s not the full story.
Why? It’s just a snapshot from your survey sample size, and it doesn’t tell you how much you can trust that number.
That’s where a survey confidence interval comes in. It wraps a range around that point, like 43% to 51%, showing the likely zone where the true population value lies.
This range reflects survey reliability, revealing how shaky or solid your 47% is. Without it, you’re guessing how accurate your market research survey is, and that’s a risky bet.
The interval ties directly to margin of error and confidence interval, giving you a clearer picture of your data’s strength.
How Confidence Levels Work (90%, 95%, 99%)
Confidence levels are the backbone of how to find confidence interval. They tell you how sure you are that your interval catches the true population value.
A 95% confidence level, the gold standard in social sciences and polling, means if you ran your survey 100 times, 95 of those intervals would hit the real number.
Pick 90%, and you’re less certain but get a tighter range. If you go for 99%, you’re super sure but with a wider net.
It’s a trade-off: higher confidence levels (99%) widen the interval, covering more ground but feeling less precise, while lower ones (like 90%) shrink it but risk missing the mark.
This balance is key for survey accuracy, letting you dial in how to calculate confidence interval for your needs.
Visual Demonstration: Confidence Levels on the Same Dataset
Let’s see it in action with a market research survey result. For example, a result “62% approval with a ±3.2% margin of error at 95% confidence” means the true approval lies between 58.8% and 65.2%.
Here’s how different confidence levels shift that interval using the same data (assuming a standard error of ~1.63%):
- 90% Confidence: ±2.7% margin (using critical value 1.645), interval = 59.3% to 64.7%.
- 95% Confidence: ±3.2% margin (critical value 1.96), interval = 58.8% to 65.2%.
- 99% Confidence: ±4.2% margin (critical value 2.576), interval = 57.8% to 66.2%.
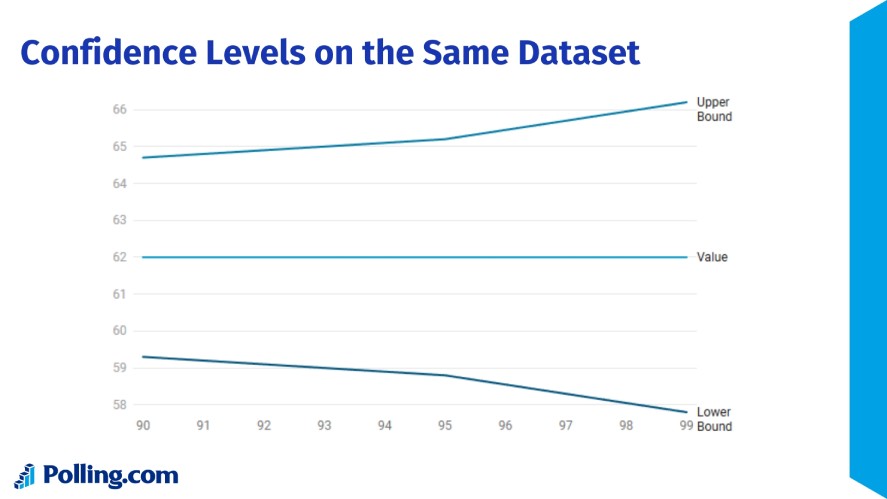
This shows confidence interval with the confidence interval formula: wider intervals (99%) trade precision for certainty, while narrower ones (90%) are riskier but sharper.
So, knowing how to find margin of error from confidence interval helps you gauge survey reliability for any market research survey.
What Affects the Width of a Confidence Interval?
The width of a confidence interval tells you a lot about the uncertainty in your market research survey.
What is confidence interval if not a reflection of your data’s quirks? Here’s what shapes whether your interval is razor-sharp or wide as a barn door.
1. Sample Size
Your survey sample size is a big player in how to calculate confidence interval.
Bigger samples, like 1,000 respondents versus 100, cut down the standard error, which measures how much your sample might wobble from the true population.
That means larger samples give narrower intervals, pinning down the real number with more accuracy and precision in surveying.
For example, a 60% approval rating from 1,000 people might have a ±3% margin of error, while 100 people could push it to ±10%.
Small samples, though, leave more uncertainty, widening the interval and making your survey reliability shakier.
2. Variability in the Data
The spread of your answers also tweaks the width of what are confidence intervals.
High variability, like a polarized 50-50 split on “Do you like our product?” (high standard deviation), means more uncertainty, so the interval stretches wider to cover the chaos.
Low sampling variability, say 90% saying “Yes” to a yes/no question (low standard deviation), keeps things tight, narrowing the interval.
The confidence interval formula hinges on this. Standard error grows with data spread, so diverse or split answers in your market research survey push how to find confidence interval to broader ranges, signaling less precision.
3. Survey Methodology and Bias
Your survey’s setup can mess with margin of error and confidence interval if you’re not careful.
Non-random sampling, like only polling online users, can skew results, introducing coverage error (missing parts of the population) or selection bias (favoring certain groups).
Poor question design, like vague or leading prompts, adds noise, while nonresponse bias, when only certain folks answer, distorts the sample.
These flaws inflate uncertainty, widening your interval and hurting survey reliability.
To keep intervals tight, use random sampling and clear questions. Otherwise, you’re not just finding how to calculate margin of error, you’re battling a data mess that undermines your whole market research survey.
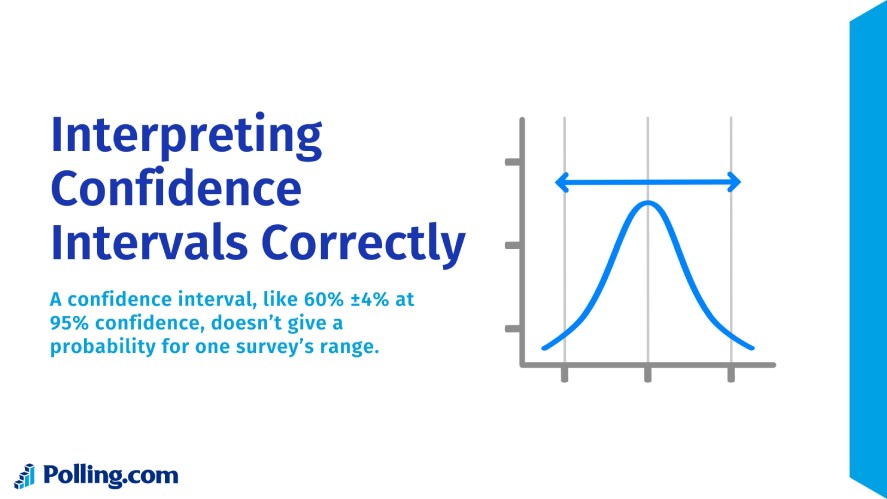
Interpreting Confidence Intervals Correctly
Understanding what is a confidence interval is one thing, getting how to read it right is another.
Missteps here can worsen your poll’s credibility, so let’s clear up what confidence intervals mean, what they don’t, and how to make sense of them for survey reliability.
First, a common mistake: saying “There’s a 95% chance the true value is in this range” is totally wrong. A confidence interval, like 60% ±4% at 95% confidence, doesn’t give a probability for one survey’s range.
Instead, here’s how to find confidence interval meaning. If you ran the same survey 100 times with different samples, 95 of those intervals would capture the true population value, like the real percentage of satisfied customers.
It’s about the process, not a single shot. Think of it as a long-term batting average for confidence interval, not a guarantee for one result.
Another trap? Overlapping confidence intervals don’t always mean “no difference” between two stats.
If two intervals, like 50% ±3% and 48% ±3%, overlap, it’s tempting to say the numbers are tied, but that’s not a hard rule.
Statistical tests (like a z-test) are needed to confirm if the difference is real, as overlap can still hide a significant gap, especially with large survey sample sizes.
Case Example: Comparing Two Survey Results
Let’s dig into a real-world example to see how to calculate confidence interval and margin of error in action.
Let’s say a poll compares two candidates’ approval ratings:
- Candidate A: 52% ±3% (95% confidence), so the interval is 49% to 55%.
- Candidate B: 49% ±2.5% (95% confidence), so the interval is 46.5% to 51.5%.
What can we infer? Candidate A’s point estimate (52%) is higher than B’s (49%), but the intervals overlap, 49% to 51.5%, is common ground.
This means we can’t confidently say A is leading. The true values could be closer or even flipped, as the margin of error and confidence interval suggest uncertainty.
To know for sure, you’d need a statistical test or a larger sample to shrink the intervals.
What we can’t do is assume A is ahead just because 52% beats 49%. That ignores confidence interval and risks a shaky call.
Survey Confidence Interval vs. Margin of Error
When digging into survey reliability, margin of error and confidence interval are like siblings.
They’re related but not identical. So, knowing what is a confidence interval versus margin of error (MOE) helps you avoid missteps in your market research survey.
Margin of error is a simplified slice of a confidence interval, showing just the wiggle room around your survey’s result, typically at 95% confidence.
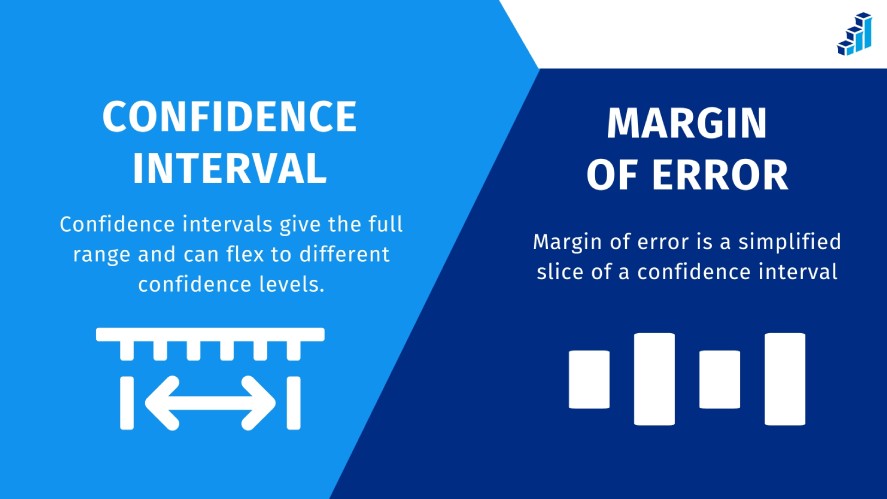
For example, if a poll says 60% ±4%, that ±4% is the MOE, meaning the true value likely falls between 56% and 64%. It’s half the width of confidence interval, calculated as MOE = Critical Value × Standard Error.
Confidence intervals (CIs), on the other hand, give the full range, like 56% to 64%, and can flex to different confidence levels (90%, 99%), offering more context about survey sample size and variability.
The difference? MOE is a quick headline number, often tied to 95% confidence, but it skips details like how confidence level or survey methodology tweaks the range.
Confidence intervals show the whole picture, tying directly to the confidence interval formula for a deeper read on accuracy and precision in surveying.
When media or companies flash MOE alone, it can mislead by oversimplifying. Without the CI’s context, you might miss that a smaller survey sample size or high variability widens the true uncertainty.
When Should You Use Each?
The choice between MOE and CI depends on your audience and goal.
For journalists or the public, margin of error is king. Its simplicity shines in headlines or quick reports, like “Candidate X leads by 5% ±3%”.
But for analysts and researchers, confidence intervals are the go-to. They offer accuracy and depth, letting you tweak confidence levels or dig into how to construct confidence interval for nuanced insights.
So, stick with MOE for broad strokes, but lean on CI for the heavy lifting in market research surveys to avoid misinterpretation traps.
Real-World Applications of Confidence Intervals in Surveys
What is a confidence interval if not a tool to make sense of the noise in real-world surveys?
From elections to product launches, confidence intervals (CIs) are key to understanding survey reliability across fields. Here’s how they shine in action.
Political Polling
In predicting election outcomes, CIs are a lifeline for gauging confidence interval around voter preferences.
Take the 2016 US presidential election as an example. Polls showed Clinton at 46% ±3% and Trump at 43% ±3% (95% confidence), with overlapping intervals hinting at a tight race.
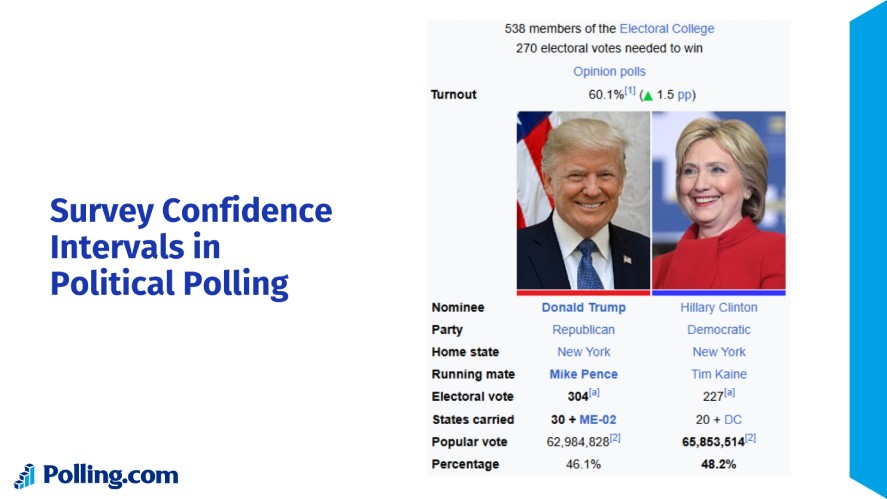
The true result (Trump’s win) fell within some polls’ margin of error, but narrow CIs misled some into overconfidence.
Similarly, the 2016 Brexit referendum had “Remain” at 48% ±4% and “Leave” at 46% ±4%. The overlap signaled uncertainty, and Leave’s 52% win fit within the range.
Confidence interval helped analysts avoid calling it too early, showing why CIs are critical for survey sample size in high-stakes polling.
Market Research
For customer satisfaction or demand forecasts, CIs pin down what customers really think.
A retail survey might report 75% satisfaction ±5%. Using confidence interval, you know the true rate is likely 70% to 80%.
This guides decisions like launching a new product or tweaking services without banking on a single number.
In demand forecasts, a survey showing 30% interest in a new gadget ±6% helps firms plan inventory, balancing risk with accuracy and precision in surveying. CIs ensure market research surveys don’t overpromise or flop.
Healthcare
Patient surveys and treatment feedback lean on CIs to measure outcomes reliably.
A hospital survey might find 85% of patients rate care as “good” ±4%. And knowing how to calculate margin of error, the true satisfaction could be 81% to 89%, guiding staff training or policy tweaks.
UX/Tech
In A/B testing with user behavior surveys, CIs clarify what’s working.
Say a tech firm tests two website designs: Design A gets 65% preference ±5%, Design B gets 60% ±5%. Overlapping intervals mean it’s too close to call without more tests, and confidence interval prevents rash redesigns.
An app survey with 70% ±6% liking a new feature uses the confidence interval formula to weigh if it’s worth rolling out. So, CIs boost survey reliability, ensuring UX decisions aren’t just guesswork.
Common Misunderstandings and Pitfalls
Getting how to calculate confidence interval is only half the battle, misinterpreting it can lead you astray in your market research survey.
Here are the big traps to dodge for solid survey reliability.
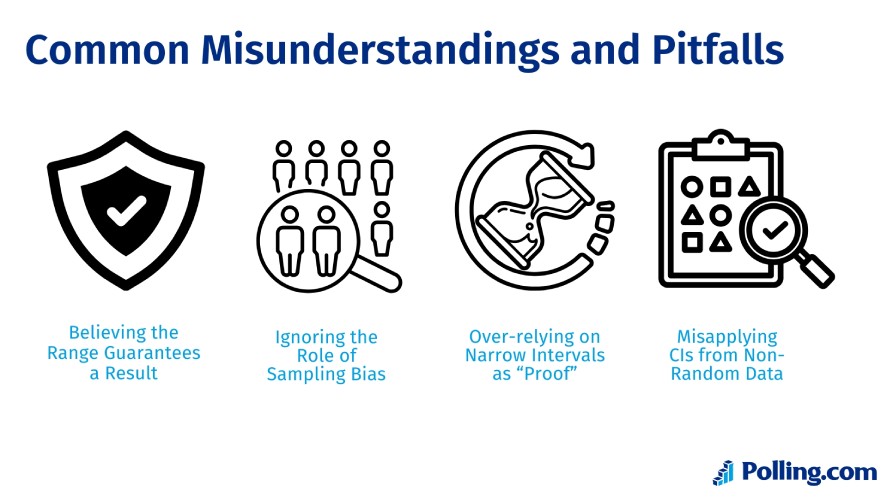
Believing the Range Guarantees a Result
A confidence interval, like 55% ±4% at 95% confidence, doesn’t mean the true value is definitely between 51% and 59%.
It means if you ran the survey 100 times, 95 of those intervals would catch the real number.
Thinking the range is a sure bet ignores the 5% chance the true value is outside it, which can overstate accuracy and precision in surveying and lead to bad calls.
Ignoring the Role of Sampling Bias
Confidence intervals assume your survey sample size is random and representative.
If it’s not, like polling only urban voters for a national election, bias can skew results, and no amount of math in the confidence interval formula fixes that.
A biased sample makes your interval misleading, tanking survey reliability even if the math looks clean.
Over-relying on Narrow Intervals as “Proof”
A tight interval, say ±2%, feels super precise, but it’s not proof your result is rock-solid.
Narrow intervals often come from large samples, but if the survey’s design is flawed (bad questions, nonresponse bias), precision doesn’t equal accuracy.
Banking on how to find margin of error from confidence interval without checking methodology can make you overconfident in shaky data.
Misapplying CIs from Non-Random Data
Confidence intervals are built for random samples.
If your data’s from a convenience sample, like a website pop-up survey, applying confidence interval is like putting racing tires on a skateboard.
The stats might look legit, but they don’t reflect the population, making your margin of error and confidence interval unreliable for real-world decisions.
How to Spot Misleading Uses of Survey Confidence Intervals
Confidence intervals get spun in media or marketing all the time. Here’s how to catch the tricks.
Let’s say a headline blares, “70% love our product! ±3%” but skips the sample size or how respondents were picked. That’s a red flag, as without knowing if it’s 50 or 5,000 people, or if it’s random, you can’t trust the survey reliability.
Or take election polls hyping tight races with overlapping intervals (like 48% ±3% vs. 46% ±3%) without mentioning statistical significance. Overlap doesn’t mean a tie, but it’s spun that way.
To avoid the spin, ask for the full statistical context: What’s the survey sample size? Was it random or opt-in? What’s the confidence level?
If a company or news outlet can’t share how to calculate confidence interval details, like standard error or methodology, it’s probably hiding something.
Digging into these ensures your market research survey isn’t swayed by flashy but flimsy stats, keeping your insights grounded.
Tools and Techniques for Calculating Confidence Intervals
Calculating a confidence interval for your market research survey doesn’t have to be daunting, as a variety of tools can help you nail confidence intervals with ease.
For those who prefer a hands-on approach, a basic calculator method lets you calculate confidence interval manually using the confidence interval formula: CI = Sample Statistic ± (Critical Value × Standard Error).
By plugging in your survey’s proportion or mean, sample size, and standard deviation, you can compute the margin of error and confidence interval, which is perfect for small surveys or learning the ropes of survey reliability.
However, this method can get tedious for large datasets or complex calculations, especially when juggling multiple questions.
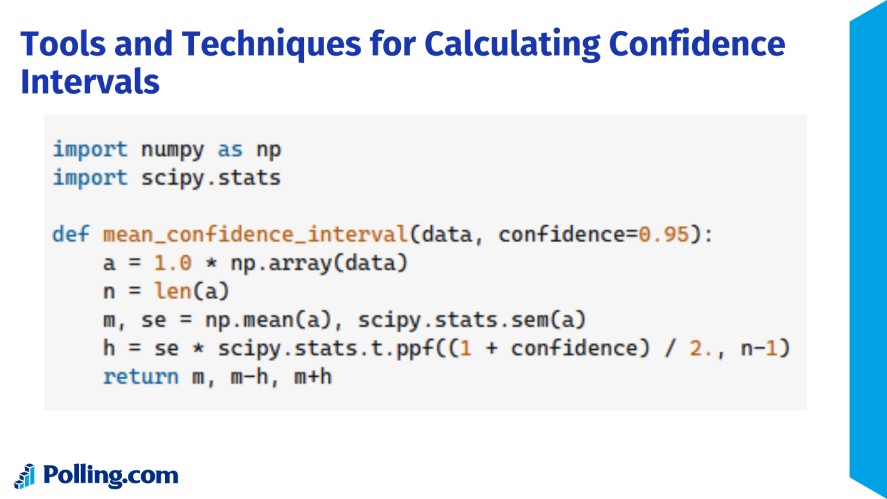
When you need more power, statistical software like R, SPSS, or Python’s SciPy library steps in to streamline how to construct confidence interval.
For instance, R’s t.test() or SciPy’s stats.norm.interval() can churn out accurate intervals in seconds, factoring in survey sample size and variability with minimal effort.
Similarly, SPSS offers user-friendly, point-and-click options that are a favorite among social scientists analyzing respondent data, ensuring accuracy and precision in surveying.
If coding or manual math isn’t your thing, online survey platforms provide a quick alternative for how to find confidence interval.
Tools like Polling.com or Qualtrics often include built-in analytics that automatically compute confidence intervals and margin of error once you upload your data.
While these are great for fast insights, they may lack the customization of statistical software for advanced needs.
Step-by-Step: Calculate a Survey Confidence Interval Manually
To see how to find confidence interval in action, let’s compute one by hand for a market research survey where 60% of 400 respondents are satisfied, aiming for a 95% confidence level.
First, identify the sample statistic: the proportion (p) is 0.6 (60%). Next, note the sample size: n = 400.
Then, calculate the standard error (SE) for a proportion using SE = √[p(1-p)/n], which gives √[0.6 × 0.4 / 400] = √[0.24 / 400] = √0.0006 ≈ 0.0245.
After that, find the critical value for 95% confidence, which is 1.96 from standard normal tables.
Now, compute the margin of error: MOE = z × SE = 1.96 × 0.0245 ≈ 0.048 (or 4.8%).
Finally, construct the CI: CI = p ± MOE = 0.6 ± 0.048 = 0.552 to 0.648 (or 55.2% to 64.8%).
This means you’re 95% confident the true satisfaction rate falls between 55.2% and 64.8%.
Best Practices for Reporting Survey Results with Confidence Intervals
When sharing your market research survey results, presenting what is a confidence interval clearly is crucial for survey reliability and trust.
Start by always including the confidence interval (CI) or margin of error (MOE) alongside your findings, like “65% approval ±4%,” to show the range where the true value likely lies, and never just a single number like 65%.
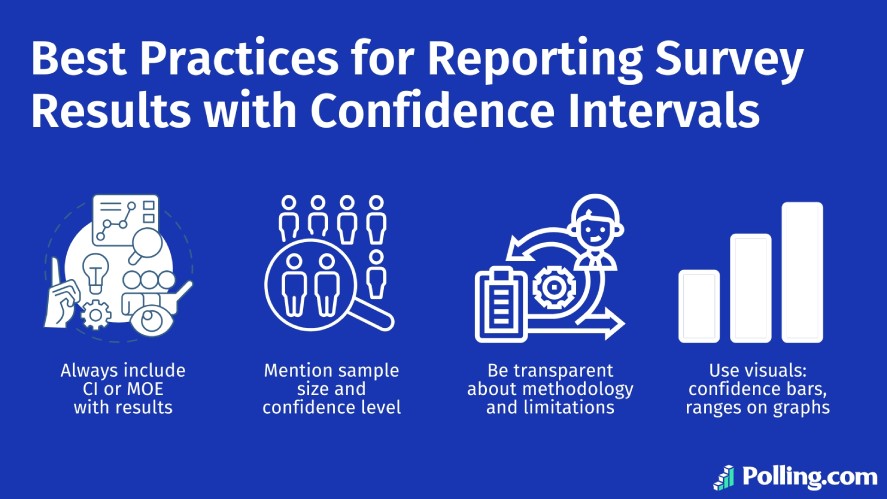
Additionally, mention the survey sample size (500 respondents, for example) and confidence level (typically 95%) to give context for how to calculate confidence interval, as these details reveal the strength of your data.
Transparency about methodology, whether you used random sampling or an online panel, and limitations, such as potential nonresponse bias, helps readers understand accuracy and precision in surveying without overhyping results.
Finally, leverage visuals like confidence bars or range graphs to make confidence interval pop, as a chart showing 61% to 69% is way easier to grasp than raw numbers, ensuring your audience gets the full picture of your survey’s reliability.
Why Confidence Intervals Should Always Be Part of Survey Interpretation
Surveys are powerful tools for capturing insights, but they come with uncertainty, and confidence intervals are the best way to express that uncertainty honestly, grounding your market research survey in reality.
Whether you’re measuring customer satisfaction or public opinion, CIs like 60% ±5% show the wiggle room in your data, making confidence interval a must for clarity.
By prioritizing transparency, you build trust, especially when your findings drive big decisions or public communication, like shaping a product launch or reporting election polls.
Understanding survey uncertainty is key—now put that knowledge to use. Create surveys with built-in confidence intervals using Polling.com and start gathering more reliable data today. Get started here!