Statistical Significance: When Is Your Data Actually Trustworthy?
You’ve poured effort into your survey results, but how do you know if the data’s actually telling you something real?
That’s where statistical significance comes in, helping you separate meaningful insights from random noise in survey analysis. Ignore it, and you risk misreading survey data.
Missteps here can lead to bad calls, like tweaking programs that don’t need fixing.
Polling.com’s survey platform makes interpreting survey results a breeze, with tools that highlight statistical relevance so you can trust your next move, no math PhD needed.
What Is Statistical Significance in Survey Results?
Statistical significance is your survey’s way of saying: “This result probably didn’t happen by chance”.
In simple terms, it tells you if differences in survey data, like 55% of parents vs. 45% of teachers approving a policy, are reliable enough to act on.
This matters in survey analysis because it keeps you from chasing false leads, ensuring your survey results hold water.
But don’t confuse it with practical significance. A statistically significant 2% preference for a new lunch menu might not justify a full overhaul.
Key Concepts Behind Statistical Significance
To nail statistical significance in survey results, you need a grip on a few core ideas that power survey analysis.
Here’s what you need to know to cut through the noise.
- Population vs. Sample: Your population is everyone you’re curious about (e.g., all voters), but you survey a sample (e.g., 1,000 voters).
- Confidence Levels: Like 95% or 99%, show how sure you are that your sample reflects the population. 95% means you’re 95% confident the results hold.
- The p-value: Or prob-value, measures if your findings are a fluke. A p-value below 0.05 (a common significance level) means your statistical difference is likely real.
- Margin of Error: Say ±3%, tells you how much your results might wiggle (e.g., 50% approval could be 47–53%).
For example, in a political approval survey analysis, if 52% of 500 voters approve a candidate with a p-value of 0.03 and ±4% margin, you can trust the approval is real, not random.
What Is a P-Value and Why Does It Matter?
A p-value represents the probability of getting your observed survey results, or something more extreme, assuming the null hypothesis is true.
In simple terms, the p-value formula is:
P-value ≈ probability(your data | no real effect)
Common Thresholds:
- p < 0.05: Common standard for statistical significance
- p < 0.01: Strong evidence against the null
- p > 0.10: Weak or no evidence
Example of the p-value interpretation:
- If 60% of customers say they prefer feature A, but the p-value is 0.50, there’s a high likelihood this preference is random.
- If p = 0.01, there’s strong evidence that customers genuinely prefer feature A.
Statistical vs. Practical Significance: What’s the Difference?
Let’s say a survey reveals that 51% of users prefer blue folder icons, while 49% prefer green.
With a large enough sample, this 2% difference might yield a statistically significant result (e.g., p = 0.04). But does this small margin justify a redesign?
Statistical significance means the result is unlikely to be random. On the other hand, practical significance asks: is the difference meaningful enough to act on?
In this case, a slight preference for blue may not warrant design changes, especially if the switch requires resources or affects usability.
Statistical Significance vs. Confidence Intervals
While p-values give a binary “significant or not” answer, confidence intervals show a range within which your result likely falls.
They’re especially helpful for understanding uncertainty and practical differences. For example:
- Group A: 70% ± 5%
- Group B: 64% ± 5%
Since the intervals don’t overlap, this difference may be significant. But if they do overlap, you likely don’t have a real difference, even if the raw numbers suggest so.
Confidence intervals help contextualize your findings beyond p-values alone.
How to Test for Statistical Significance in Surveys
Testing for statistical significance in survey results lets you confirm your survey data isn’t just a happy accident.
Whether it’s a school survey or a market research poll, a clear process ensures your survey analysis yields trustworthy insights.
Follow these steps to get the green light on your findings, using survey platforms like Polling.com to streamline data analysis in survey—no stats wizardry required.
1. Define Null and Alternative Hypotheses
Begin by clearly stating your null hypothesis (H₀). This assumes there’s no effect or difference in your survey results.
For example: “There’s no difference in satisfaction between online and in-person students”.
Then define your alternative hypothesis (H₁).
This is what you hope to prove through your data: “Online students are more satisfied than in-person students”.
Having clear hypotheses upfront gives your survey analysis direction and helps ensure your statistical testing is meaningful.
2. Choose the Right Test
The next step is selecting a test that fits your data type:
- For numerical data (like average satisfaction scores), use a t-test to compare two groups (e.g., male vs. female students).
- For categorical data (like yes/no answers), a chi-square test helps assess relationships or preferences (e.g., product choices by age group).
Choosing the correct test ensures your results are valid and your data-driven conclusions sound.
3. Calculate P-Value
Once you run the appropriate test, you’ll get a p-value. This tells you how likely your results are if the null hypothesis were true.
If your p-value is below 0.05, you can typically reject the null hypothesis, suggesting a statistically significant difference.
Tools like Polling.com calculate p-values automatically, saving you the math and helping you focus on insights.
4. Interpret Results
A low p-value (like 0.03) indicates your findings are statistically significant, supporting the alternative hypothesis.
But don’t stop there! Also ask whether the result is practically significant.
For instance: A 51% vs. 49% product preference might be statistically significant, but may not justify a business change.
Platforms like Polling.com help by offering intuitive reports and charts so you can understand not just if something is significant but why it matters.
How Polling.com Makes Statistical Significance Testing Easier
Polling.com’s survey platform takes the headache out of statistical significance testing with a user-friendly interface that guides you through survey analysis.
You can select pre-built templates for school surveys or market polls, and its real-time analysis crunches survey data to show p-values and statistical differences instantly.
Compared to SurveyMonkey’s paywalled advanced analytics or Qualtrics’ steeper learning curve for non-experts, Polling.com balances simplicity and power, making interpreting survey results accessible for all.
How Sample Size Affects Statistical Significance
Sample size plays a crucial role in determining whether your survey findings are statistically significant.
In simple terms, the more responses you collect, the more confident you can be that your observed trends reflect reality and not just random chance.
Why Sample Size Matters
Statistical tests rely on the power of your data to detect meaningful differences. A larger sample size increases that power, making it more likely that you’ll spot real patterns, even subtle ones.
On the flip side, a small sample can fail to detect genuine effects, leading to false negatives (also called Type II errors). Worse, with too few responses, even large differences can be dismissed as statistically insignificant.
A small sample also tends to have a higher margin of error, which can make survey results appear vague or inconsistent. This often leads to confusion or poor decision-making when interpreting data.
Example: Sample Size vs. P-Value
Let’s say you’re testing whether 55% of customers prefer Product A over Product B (instead of a 50/50 split).
Here’s how your sample size affects the p-value:
| Sample Size | Detected Difference | P-Value | Significance |
|---|---|---|---|
| 50 | 5% | 0.19 | ❌ Not significant |
| 500 | 5% | 0.02 | ✅ Statistically significant |
With only 50 responses, the p-value is too high to confirm the trend confidently. But with 500 responses, that same 5% difference becomes statistically meaningful.
The Danger of Underpowered Surveys
If your survey is too small, you’re likely wasting time and resources. Because no matter how promising your data looks, you may not be able to act on it.
This is why experienced researchers calculate the required sample size before launching a survey, based on:
- The size of the difference they expect to detect (effect size)
- The desired confidence level (e.g., 95%)
- The acceptable margin of error
There are many free tools online (including Polling.com) that can help estimate how many responses you’ll need to make your data statistically valid. Just input your confidence level, expected effect size, and margin of error, and the calculator does the rest.
Common Mistakes When Interpreting Significance
Even with solid survey results, it’s easy to trip up when interpreting survey results for statistical significance. Avoiding these pitfalls ensures your survey analysis stays credible and actionable.
You might misunderstand p-values, thinking a p-value of 0.05 means a 95% chance your hypothesis is true, but it doesn’t. It only shows a 5% chance the results happened under the null hypothesis.
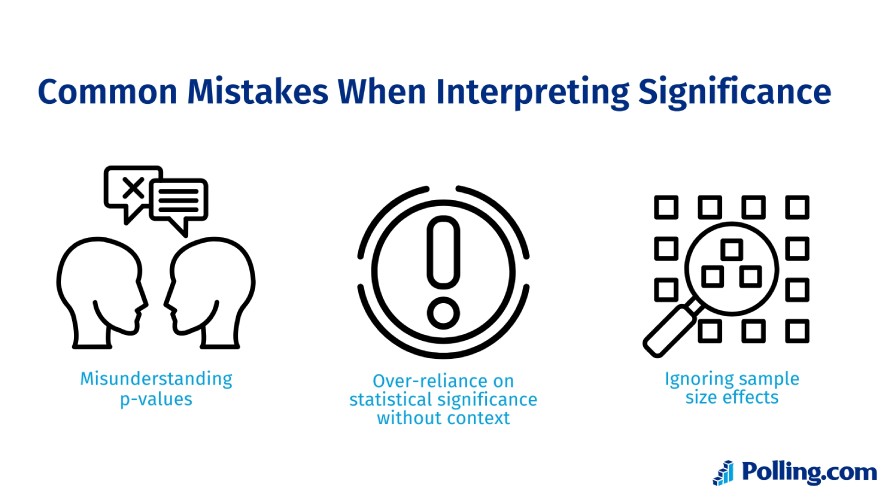
Over-relying on statistical significance without context is another trap.
A statistically significant result in a school survey showing 1% more students prefer blue folders isn’t worth a policy change.
Lastly, ignoring sample size effects can also skew survey data. Large samples make tiny differences significant, while small ones hide real trends.
Best Practices for Reporting Statistically Significant Results
You’ve nailed your statistical significance test; now it’s time to share your survey results in a way that’s clear and convincing.
Reporting survey data effectively means using visuals, being transparent, and tying findings to real-world decisions, so your survey analysis sparks action.
Use visualizing significance with bar charts or line graphs to make your survey results pop—show confidence intervals (e.g., 50% ±3%) to highlight reliability.
For example, a school survey chart showing 60% student satisfaction with ±2% confidence intervals grabs attention.
Next, transparent reporting is key. Always note the test type (e.g., t-test), p-value (e.g., 0.02), and significance level (e.g., 0.05) to build trust.
Finally, provide context for decisions. Does a statistically significant 5% boost in employee satisfaction justify a new policy?
Polling.com’s data analysis in survey tools generate visuals and reports that tie survey results to business or policy goals, keeping your audience engaged.
Use Case Examples
Seeing statistical significance in action helps you grasp its power in survey analysis.
These examples show how p-values and survey data drive decisions across contexts.
Business NPS Survey
Imagine you roll out a new app feature and run a customer satisfaction survey. You hypothesize the feature boosts Net Promoter Score (NPS).
Using a t-test on 200 responses (100 pre-rollout, 100 post), you find NPS rises from 30 to 35 with a p-value of 0.04, signaling a statistical difference
Political Survey
You’re checking if a candidate’s support varies by age in a survey analysis of 600 voters.
A chi-square test compares approval rates (18–34: 55%, 35–54: 50%, 55+: 45%) and yields a p-value of 0.01, showing statistical significance.
Academic Research
You’re testing if a new teaching method improves student engagement in a school survey of 300 students.
A t-test on engagement scores (control vs. experimental group) gives a p-value of 0.03, validating your hypothesis.
Conclusion
Statistical significance is your key to trusting survey results, ensuring your survey data isn’t just noise but a reliable guide for decisions.
From running tests to reporting insights, understanding p-values and statistical differences keeps your survey analysis on point.
Polling.com’s survey platform makes this accessible with intuitive tools for data analysis in survey, no stats degree needed.
Want to make your next survey count? Run a free survey or analyze your results with Polling.com’s survey tools today.
FAQs About Statistical Significance in Surveys
A p-value below 0.05 is commonly considered statistically significant, but context matters.
Possibly, but check for data quality issues and a wide margin of error.
Don’t panic. Re-examine your sample size, test method, or whether the effect just doesn’t exist.
Yes. Tools like Polling.com do it automatically as part of our analytics suite.
No. Statistical significance tells you the result probably isn’t random; correlation measures the strength and direction of a relationship between variables.