
Relative NPS: Why Your Net Promoter Score Needs Context
Ever wonder how much your customers really love your business?
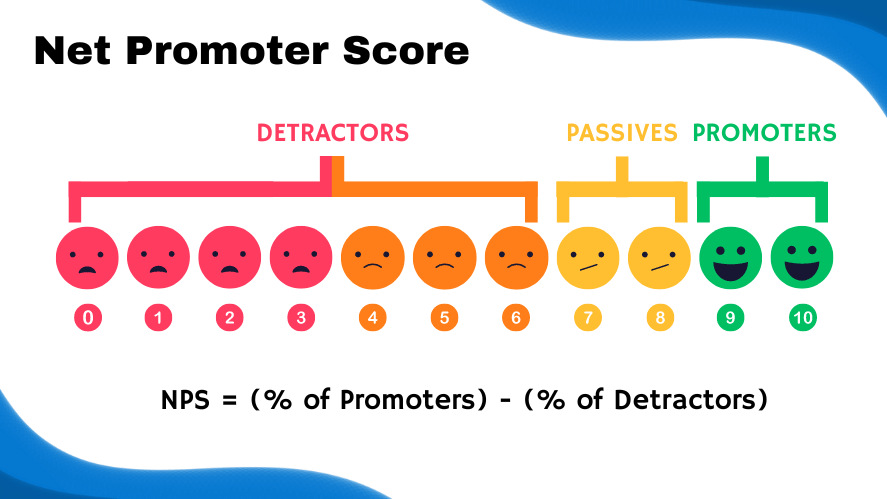
That’s where the Net Promoter Score (NPS) comes in, a simple metric that asks respondents, “How likely are you to recommend us?” and spits out a score from -100 to 100.
It’s a go-to for companies, from tech startups to retail giants, because it’s quick and ties straight to customer loyalty.
But here’s the catch: an NPS score alone is like a half-told story.
Enter relative NPS, which puts your score in context by comparing it to competitors or industry benchmarks. Without this, you’re guessing if your 50 is awesome or awful.
This article dives into why relative NPS matters, how it works, and how customer feedback tools like Polling.com can help you make sense of your data for smarter decisions.
What Is Relative NPS?
To get why relative NPS is a game-changer, let’s break it down and see how it stacks up against the usual NPS score, especially when you’re trying to gauge customer loyalty with survey tools.
NPS Promoter Definition and Importance
Relative NPS is your Net Promoter Score measured against something else, like your industry’s average or your top rival’s score, serving as a real-world customer loyalty index.
Regular NPS, or absolute NPS, just gives you a raw number, say 40, based on how many respondents are promoters (9-10), passives (7-8), or detractors (0-6).
Relative NPS adds context, like knowing your 40 is great if your industry averages 20, but shaky if competitors hit 60.
Why does this matter? Because loyalty isn’t just about your score, it’s about beating the pack.
Using NPS surveys, you can benchmark your score to spot gaps and boost customer love, making relative NPS a must for online customer research.
Absolute NPS vs Relative NPS — Key Differences
So, what’s the deal with absolute NPS versus relative NPS?
Absolute NPS is your standalone score, quick to calculate and easy to track over time. However, it’s like judging a race without knowing who’s running.
A 50 might feel solid, but a peer group NPS evaluation could reveal that your industry’s rocking 70, meaning you’re actually lagging.
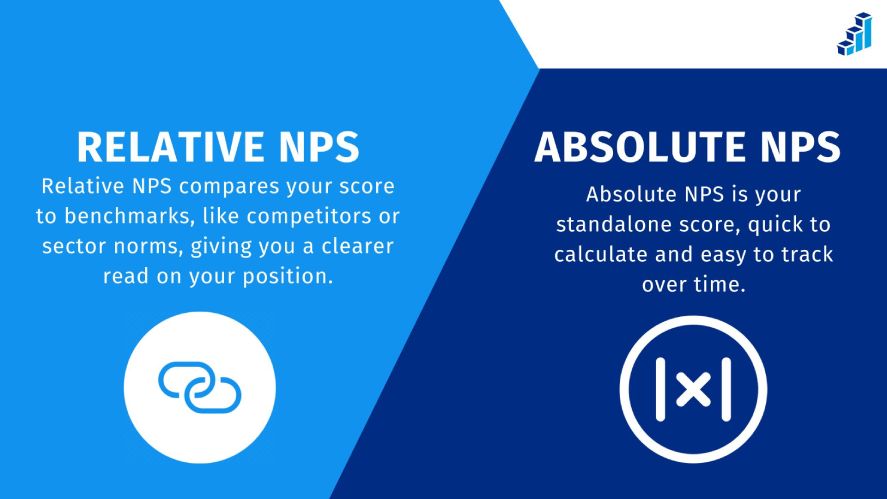
Relative NPS, on the other hand, offers a direct Net Promoter Score comparison to benchmarks, like competitors or sector norms, giving you a clearer read on your position.
The downside? It needs reliable benchmark data, which can be tricky to get without customer feedback management tools.
Take a coffee shop chain with an absolute NPS of 30, sounds okay, right? But if local competitors average 45, that 30’s a red flag, maybe your service is slow.
Now, imagine a tech firm with an NPS of 20, seems low, but if the SaaS industry averages 15, they’re killing it.
Absolute NPS can mislead without context, while relative NPS shows what’s really up, helping you prioritize fixes with survey questions to improve NPS.
Both have their place, but relative NPS wins for big-picture insights, especially when you’re using best survey tools like Polling.com to dig into the data.
Why Relative NPS Matters for Modern Businesses
In a world where customers have endless choices, relative NPS is a lifeline for understanding how your business stacks up.
Here’s why it’s a big deal for how to improve NPS.
Knowing industry benchmarks is like having a map in a crowded market. A raw NPS score tells you how your customers feel, but relative NPS shows if you’re ahead or behind the curve.
For example, a score of 35 might seem decent, but if your sector’s average is 50, you’re losing ground.
Customer feedback tools like Polling.com let you compare your score to competitors, revealing if your survey questions are hitting the mark or if you need to step up.
This context helps you focus on what drives loyalty, like faster support or better pricing, especially when benchmarking NPS across industries to see where you lag or lead.
Relative NPS also paints a true picture of customer satisfaction by acting as a customer sentiment benchmark, showing your strengths and risks.
Say you’re a gym chain with an NPS of 40, but fitness industry leaders hit 60. That NPS versus industry average gap signals a risk, maybe your classes aren’t cutting it.
Or, if you’re a software startup with an NPS of 25, beating the SaaS average of 20, you’re doing something right, like nailing onboarding.
By using NPS tools to benchmark, you can celebrate wins or spot trouble, making relative NPS key for npsmanagement and growth.
Industry Example: B2B SaaS vs Retail Benchmarks
The same NPS score can mean wildly different things depending on your industry, and relative NPS proves it.
Take a B2B SaaS company with an NPS of 30. In SaaS, where averages hover around 36, that’s below par, suggesting issues like clunky software or slow support.
Now, picture a retail store with the same NPS of 30. Retail averages closer to 50, so that 30 is a warning, maybe the checkout process is a mess.
A SaaS firm might shrug at 30, but a retailer would panic.
Relative NPS, backed by online survey tools like Polling.com, shows why context is everything. It helps you set realistic goals to improve NPS based on your industry’s norms.
How to Measure and Calculate Relative NPS
Getting a grip on relative NPS isn’t rocket science, but it takes the right steps and NPS tools to make it work. So, let’s walk through how to do it.
First, gather your own NPS data by sending out a survey with the classic question, “How likely are you to recommend us?” using a 0-10 scale. Calculate your NPS score: subtract the percentage of detractors (0-6) from promoters (9-10).
Next, hunt for benchmark data, like industry averages or competitor scores. You can dig into reports from sources, which peg SaaS at 36 and retail at 50, or use product feedback tools like Polling.com for real-time industry stats.
Then, compare your NPS to the benchmark. If your score’s 40 and your industry’s 30, your relative satisfaction score shows you’re 10 points ahead, which is a solid win.
Net Promoter tools make this a breeze, and Polling.com stands out as the top pick.
Unlike clunky platforms, Polling.com pulls industry-specific benchmarks in seconds, so you’re not stuck Googling stats. Its Net Promoter Score software lets you run surveys, track scores, and compare them to competitors, all in one place.
Whether you’re using free survey tools or premium ones, Polling.com’s focus on relative NPS helps you see if your survey questions are driving loyalty or falling flat, streamlining online customer research like never before.
Why Use Polling.com for NPS Benchmarking
Polling.com is your secret weapon for relative NPS, and here’s why it beats the pack.
It delivers real-time industry benchmarks, so you’re always comparing your score to the latest SaaS, retail, or healthcare averages, no stale data here.
Its custom reporting and user-friendly dashboards make npsmanagement a snap, letting you visualize your NPS against competitors in clean charts even your boss can follow.
Plus, Polling.com’s data is more reliable and comprehensive than big names like SurveyMonkey or Qualtrics, pulling from broader, fresher sources to ensure your NPS survey tools give you the full picture.
For businesses serious about how to increase NPS, Polling.com’s best survey tools make competitive NPS analysis fast, clear, and actionable.
Best Practices for Using Relative NPS to Drive Growth
Relative NPS isn’t just about knowing your score’s context, it’s about using that insight to grow. So, let’s dive into how to make it work for your business.
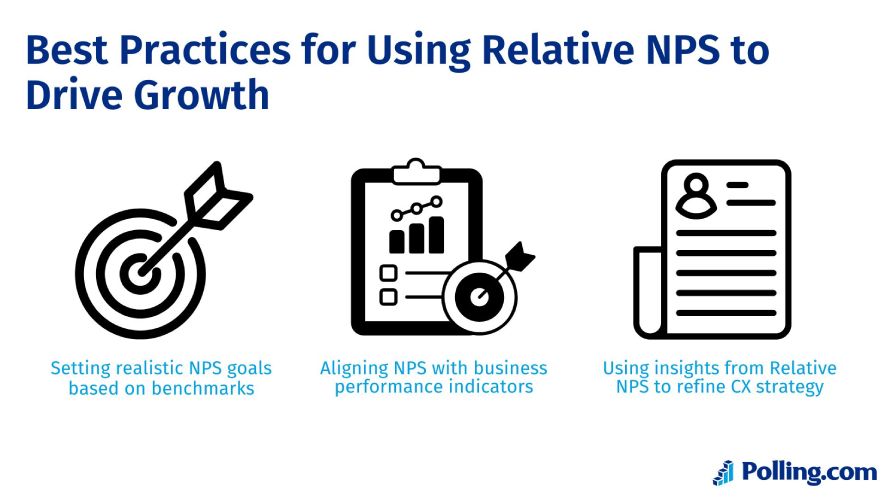
First, set realistic NPS goals by leaning on industry benchmarks.
If you’re a retailer with an NPS of 35 and the industry average is 50, aim to hit 45 before dreaming of 60, it’s ambitious but doable. Surveying tools like Polling.com help you track progress against these targets, keeping your team focused.
Next, tie NPS to business performance, like sales or retention rates.
For example, if your relative NPS shows you’re 10 points above the SaaS average of 36, check if that aligns with higher renewals, it proves your loyalty edge is paying off.
Use relative NPS to sharpen your customer experience (CX) strategy. If your score lags behind competitors, say 25 versus an industry 40, dig into survey questions about support or pricing to find weak spots.
Then, act fast, maybe train your team or streamline checkout. Employee survey tools let you pivot based on real data, not guesses, boosting loyalty and growth.
When using right, relative NPS turns your score into a roadmap for winning customers, making it a core part of how to improve NPS.
Acting on Relative NPS Insights
To really milk relative NPS, slice and dice your data for deeper insights. Segment responses by demographics, channels, or customer lifecycle.
For instance, if young customers give you an NPS of 20 but your industry’s at 30, tweak your app’s UX to win them over.
In addition, feedback loops are key. So, use open-ended survey questions like “What’s one thing we could do better?” to spot issues and then fix them.
This cycle drives retention by showing customers you listen, turning passives into promoters and lifting your relative NPS.
Conclusion
Relative NPS is your ticket to understanding your Net Promoter Score in a way that raw numbers can’t match, putting your customer loyalty in context against competitors and industry norms.
Looking beyond your own score, whether it’s a 30 in retail or a 20 in SaaS, reveals if you’re leading or trailing, guiding smarter moves to improve NPS.
Don’t settle for guesswork, benchmark your NPS with best survey tools to unlock real-time insights, slick dashboards, and data you can trust.
Ready to see where you stand? Start benchmarking your NPS today with Polling.com and take your customer game to the next level!