
How to Run a TURF Analysis with Survey Data
TURF analysis plays a critical role in identifying the optimal combination of offerings that will appeal to the greatest number of people, using the smallest number of options. Whether you are trying to decide which product flavors to launch, which features to include in a new app, or which marketing messages to promote, this method gives data-backed answers.
Yet many teams are unsure how to apply it effectively. What survey format is best? How should the data be analyzed? How does TURF compare with methods like MaxDiff or Conjoint?
This guide will help you understand exactly how to run a TURF analysis using survey data, including real-world examples, step-by-step instructions, and best practices for implementation.
What Is TURF Analysis?
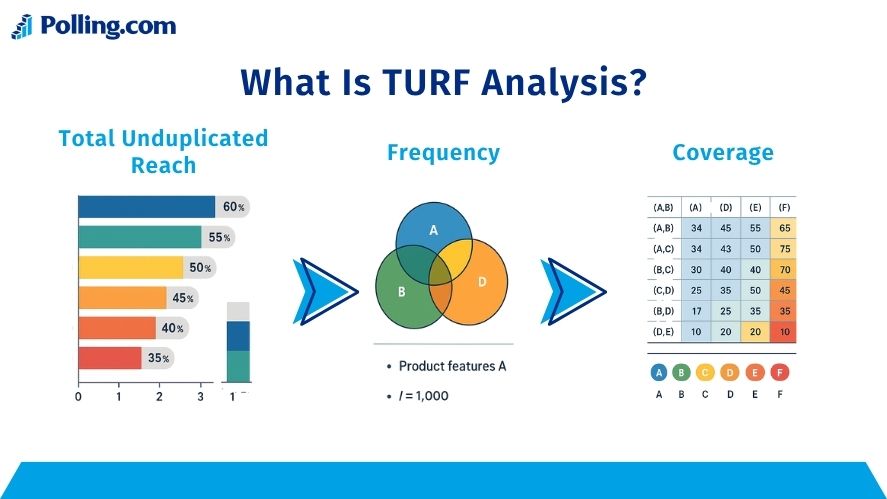
First, let’s clarify what is turf analysis. TURF stands for Total Unduplicated Reach and Frequency. It is a statistical method that helps marketers and researchers identify the combination of items that reaches the highest number of unique individuals.
The analysis focuses on unduplicated reach, which refers to how many different people can be reached with a given set of options. Rather than counting every time someone selects or prefers an item, TURF counts each individual only once, no matter how many items they choose.
Let’s break down the key components:
- Reach refers to the number or percentage of people who express interest in at least one item in a group.
- Unduplicated means each person is counted only once, regardless of how many items they like.
- Frequency measures how many items, on average, a respondent chooses from the group.
By analyzing reach and frequency together, you can find the most effective mix of products, features, or messages that covers the largest segment of your target audience.
Why TURF Is Valuable in Survey and Market Research
Now that we’ve defined the concept, let’s explore why turf analysis market research is so valuable. The primary reason is simple: most companies cannot offer everything. Constraints such as budget, shelf space, time, or user interface limitations require teams to make tough decisions about which options to include or promote.
Here are a few examples of where TURF can make a difference:
- A beverage brand wants to choose four new flavors to launch out of ten options.
- A mobile app team must decide which features to develop first.
- A marketing department needs to select the best mix of promotional messages.
In all these cases, TURF can identify the optimal combination that ensures the most people feel represented or interested. This makes it a practical and effective tool for product development, marketing strategy, and even content planning.
When to Use TURF Instead of Other Techniques
It is helpful to understand how TURF compares with other popular techniques such as Conjoint Analysis and MaxDiff. Each method serves a different purpose, and choosing the right one depends on the type of insights you are looking for.
TURF vs Conjoint Analysis
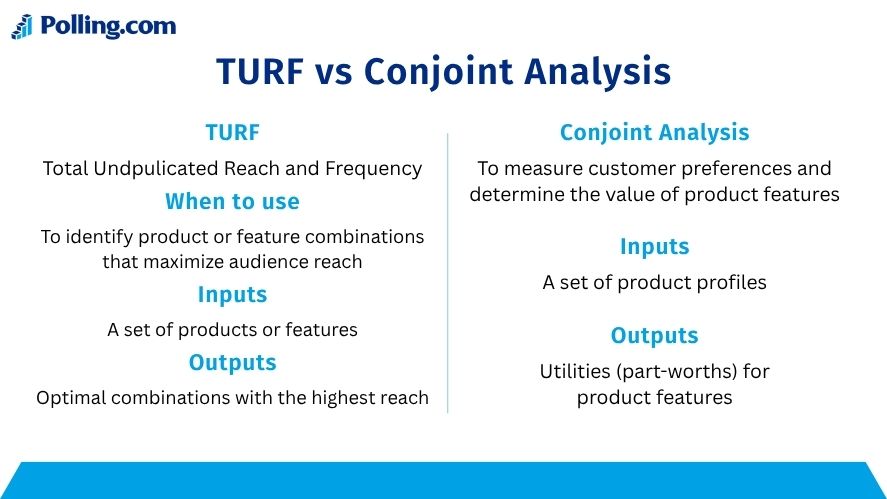
- TURF focuses on maximizing unduplicated reach. It is best used when your goal is to find the best combination of items that appeal to the widest audience.
- Conjoint Analysis is more complex and simulates real-world decision-making. It allows you to model trade-offs between different features or product configurations, including price sensitivity.
Use Conjoint when you need detailed preference modeling. Use TURF when your main concern is coverage and reach.
TURF vs MaxDiff
- MaxDiff (Maximum Difference Scaling) is ideal for ranking a list of items by importance. It tells you which items are most and least preferred but does not account for overlap or combinations.
- In contrast, turf analysis maxdiff comparisons show that TURF can evaluate how combinations of items work together to expand reach, something MaxDiff does not do.
In summary, if you want to prioritize items, use MaxDiff. If you want to model combinations, use TURF. If you want to analyze trade-offs, use Conjoint.
Basics of TURF Analysis
Understanding how TURF works begins with its core principles. These principles are key to interpreting results and applying the method correctly.
Core Concepts: Reach, Unduplication, Frequency
Let’s take a closer look at the main terms:
- Reach Reach is the count or percentage of respondents who would choose at least one item from a group. If you ask 100 people about five features and 80 of them like at least one, the reach is 80%.
- Unduplication Suppose a person likes three of the five options. In terms of reach, they are counted only once. This prevents overlap from distorting the results.
- Frequency This is the average number of selected items per person in a specific combination. If people typically like two out of five features, the frequency is 2. A higher frequency can sometimes mean stronger engagement.
The trade-off in TURF analysis is that as you add more items, you increase reach but also increase overlap. There is a point where adding more items leads to minimal additional reach, a concept we will revisit later.
When and Why to Use TURF
TURF is especially effective when you face choice limitations. These could be budget constraints, a limited amount of advertising space, or restrictions in app navigation. In any case, when you cannot offer everything to everyone, TURF helps you make the smartest choices.
Here are practical applications:
- Product Assortments: Which set of new product flavors will appeal to the largest customer base?
- Feature Bundles: Which group of app features will satisfy the most users?
- Message Mixes: Which marketing statements will cover the widest audience?
- Media Planning: Which combination of channels reaches the most unique viewers?
TURF is not perfect. It does not account for price, competition, or brand switching. It also does not model detailed trade-offs like Conjoint Analysis does. Still, it offers a fast and understandable way to maximize audience coverage.
Designing the Survey for TURF
To run a reliable TURF analysis, you need to start with well-designed survey data. That means building questions that generate the right kind of responses and collecting them from a meaningful sample.
Selecting the Candidate Items
Begin by defining a manageable list of options you want to test. These could include:
- Product variants (e.g., snack flavors, phone colors)
- Features (e.g., offline mode, dark theme)
- Benefits (e.g., easy setup, fast speed)
- Messages (e.g., “eco-friendly,” “family-focused”)
Avoid overwhelming respondents with too many choices. Aim for 10 to 20 items maximum. This prevents analysis overload and keeps your survey experience user-friendly.
The quality of these items is as important as quantity. They should be distinct and relevant. If two features are too similar, they will cannibalize each other in the analysis.
Question Format and Measurement
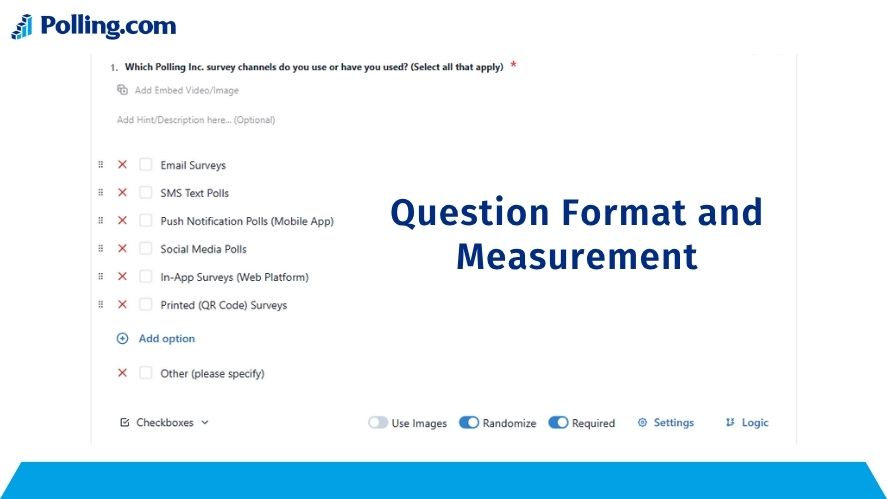
The way you ask the question plays a large role in the quality of your survey responses. Since TURF requires binary data, the most common and reliable format is the Select-All-That-Apply (SATA) question.
Example: Which of the following features would you use in a fitness app? [ ] Daily workout plans [ ] Calorie tracker [ ] Water intake reminders [ ] Social sharing [ ] Sleep monitoring
Each item gets a 1 (if selected) or 0 (if not selected), which makes it easy to process in the TURF model.
Alternatively, you can use rating scales and set a threshold. For instance, treat all ratings of 4 or 5 on a 5-point scale as a “1” in your binary matrix. This adds some flexibility, especially if you want to capture intensity of interest.
Finally, ensure that all respondents evaluate the same set of items, or if using subsets, balance them so each item gets fair exposure. This is crucial for valid survey data analysis.
Data Preparation
Once your survey is completed and cleaned, it’s time to prepare the data for analysis. Here is how to approach it:
- Create a binary matrix Each row should represent a respondent. Each column should represent an item. Every cell is either 1 (selected) or 0 (not selected).
- Handle missing data Try to design your survey in a way that prevents non-response. If missing data does occur, decide how to treat it (e.g., impute a “0” or exclude the respondent).
- Consider segmentation You can run TURF not just for the total sample but also for specific groups. For example, different age groups or customer types might respond differently. Segmented TURF analysis can uncover unique opportunities.
This preparation stage lays the foundation for effective data analysis in survey projects using TURF.
Running the TURF Analysis
Now that you’ve prepared your survey data as a binary matrix, you’re ready to run the turf analysis. This part of the process involves systematically testing combinations of your candidate items to determine which mix delivers the highest unduplicated reach with an acceptable level of frequency.
Combination Enumeration and Reach Calculation
To begin, decide on a portfolio size. This refers to how many items you can realistically include in your final offering. For example, let’s say your marketing team can only promote three out of ten messages due to space limitations.
Here’s how to proceed:
- Generate All Possible Combinations Use a programming tool like R, Python, or Excel to list every possible combination of three items from the total set. For ten items, there are 120 unique triplets.
- Calculate Unduplicated Reach For each combination:
- Check how many respondents selected at least one of the three items.
- Count them once, even if they selected two or all three.
- This gives you the reach of that combination.
- Calculate Frequency Still within each combination:
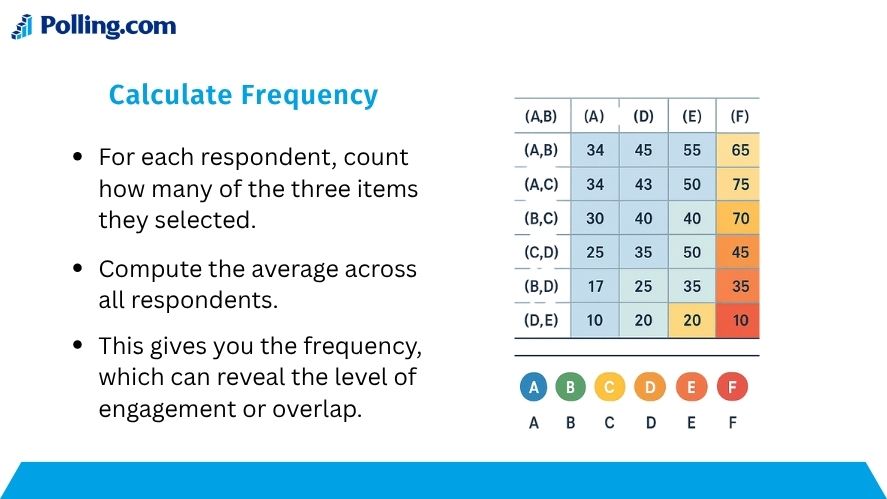
- For each respondent, count how many of the three items they selected.
- Compute the average across all respondents.
- This gives you the frequency, which can reveal the level of engagement or overlap.
This combination-and-evaluation process is at the heart of survey data analysis methods used in TURF. While reach is usually the main metric, frequency can help you judge whether a small drop in reach is acceptable for higher depth of interest.
Interpreting the Output
Once your analysis is complete, you will have a list of combinations, each with its associated reach and frequency scores. Here’s how to interpret and use those results.
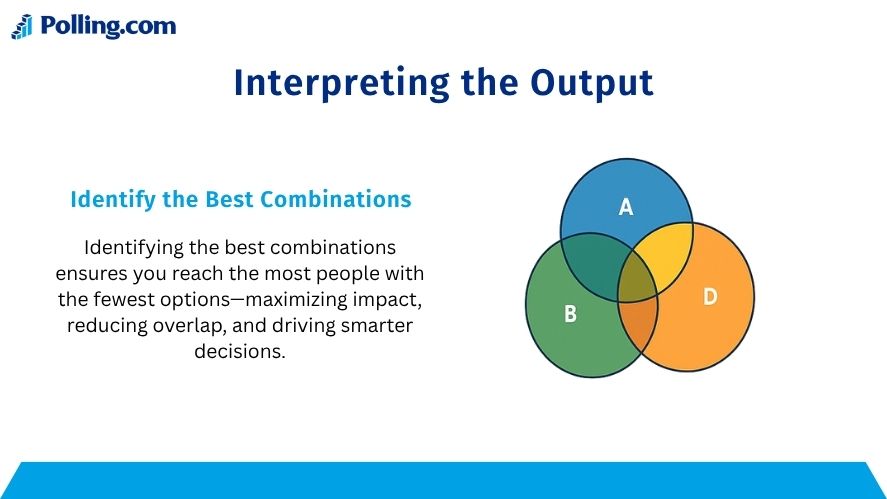
1. Identify the Best Combinations
Sort your combinations by highest reach. The top combinations will be your starting point for decision-making.
2. Evaluate Marginal Gain
Look at how much additional reach you gain by increasing the portfolio size from three to four or from four to five items. If the gain drops below a reasonable threshold (for example, 2 percent), it may not justify the added cost or complexity.
3. Consider Frequency and Overlap
Sometimes a combination with slightly lower reach but significantly higher frequency may be preferable. This means more people are choosing multiple items, which could suggest stronger engagement or higher satisfaction.
4. Balance With Business Constraints
Your analysis must also take into account practical business concerns:
- Can you afford to offer the selected items?
- Are there operational limits to supporting them?
- Could the selected items cannibalize each other?
TURF is a tool to support decision-making. The final choice should integrate both data and strategic judgment.
TURF Analysis Example (Simplified)
To make the process more concrete, let’s walk through a simplified turf analysis example.
Scenario:
You run a snack brand and want to launch 3 out of 5 new flavors. You conducted a survey using a select-all-that-apply format.
Survey Results (Binary Matrix – Sample):
| Respondent | A | B | C | D | E |
|---|---|---|---|---|---|
| 1 | 1 | 0 | 1 | 0 | 1 |
| 2 | 0 | 1 | 1 | 1 | 0 |
| 3 | 1 | 1 | 0 | 0 | 0 |
| 4 | 0 | 0 | 1 | 1 | 1 |
Step 1: Enumerate Combinations of 3 Items
Example:
- A + B + C
- A + B + D
- A + C + E (10 total combinations for choosing 3 out of 5)
Step 2: Calculate Reach
Let’s say:
- A + C + E reaches 85% of respondents
- A + B + D reaches 80%
- B + C + D reaches 83%
Step 3: Select the Best Combination
You might find that A, C, and E offers the highest unduplicated reach, even though A, B, and C includes the most individually popular flavors. This demonstrates the value of TURF: it shows how combinations behave together rather than just ranking items independently.
This simplified survey analysis illustrates how a small change in combinations can significantly impact overall coverage.
Advanced Considerations and Best Practices
As you grow more comfortable with turf analysis, there are several advanced topics and techniques you should consider to increase accuracy and relevance.
Diminishing Returns and Optimal Portfolio Size
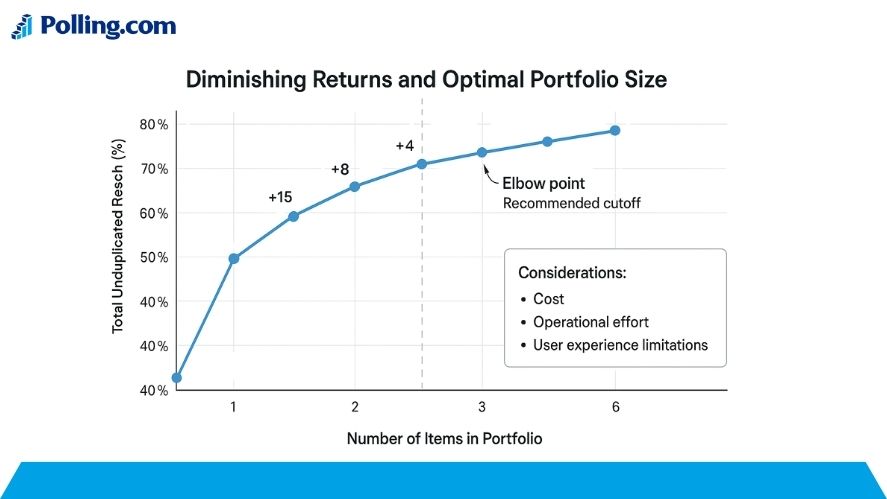
A common issue in TURF analysis is deciding how many items to include. Adding more items typically increases reach, but the marginal gain tends to decrease over time.
To handle this:
- Graph the reach at each portfolio size (e.g., 1 to 6 items).
- Look for the elbow point—the moment when adding another item no longer improves reach meaningfully.
- Use this point as your recommended cutoff.
Also, weigh this decision against resource constraints such as cost, operational effort, or user experience limitations.
Segmented TURF
Not all users have the same preferences. In many cases, running a single TURF analysis for your entire population can mask meaningful differences between segments.
To address this, run segmented TURF analyses for key groups:
- Demographics (age, gender, location)
- Behavioral segments (heavy users vs. light users)
- Customer types (B2B vs. B2C)
You may discover that:
- Segment A prefers a different set of features than Segment B.
- A combination that works well overall performs poorly in certain regions.
Segmented TURF can help you tailor offerings to specific groups, increasing both reach and relevance.
Software Tools and Implementation
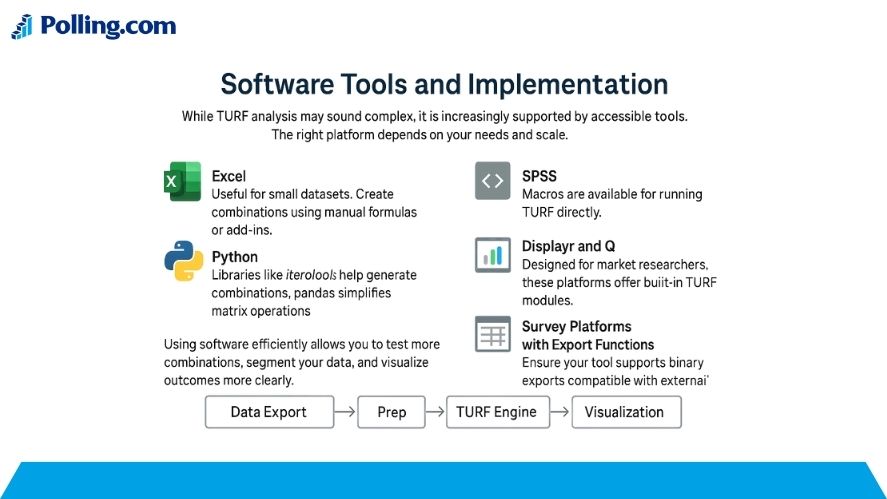
While TURF analysis may sound complex, it is increasingly supported by accessible tools. The right platform depends on your needs and scale.
Options include:
- Excel: Useful for small datasets. Create combinations using manual formulas or add-ins.
- R: Use the combn() function and data frames to evaluate reach.
- Python: Libraries like itertools help generate combinations. pandas simplifies matrix operations.
- SPSS: Macros are available for running TURF directly.
- Displayr and Q: Designed for market researchers, these platforms offer built-in TURF modules.
- Survey Platforms with Export Functions: Ensure your tool supports binary exports compatible with external analysis.
Using software efficiently allows you to test more combinations, segment your data, and visualize outcomes more clearly.
Pitfalls and Limitations
As useful as turf analysis is, there are important limitations to keep in mind:
1. No Price or Profit Consideration
TURF treats all items equally in terms of cost and revenue. An item that reaches more people but has lower margins may not be the best choice from a business perspective.
2. No Competition Modeling
Unlike Conjoint, TURF does not account for the presence of competitors or substitutes. It assumes each choice exists in isolation.
3. Risk of Overemphasis on Reach
Maximizing reach is valuable, but it can come at the cost of depth or satisfaction. Always review frequency and other secondary metrics to avoid shallow engagement.
4. Computational Complexity
As the number of candidate items increases, the number of possible combinations grows rapidly. Be mindful of limits when choosing the size of your test set.
These factors do not undermine TURF but rather emphasize the need to use it thoughtfully and in combination with other insights.
Relating TURF to Polling.com’s Survey Platform (or Your Tool)
If you’re using a survey platform like Polling.com or another provider, it’s worth considering how well the tool supports TURF-based research.
Here’s what to look for:
1. Survey Design Support
Ensure the platform allows for:
- Select-all-that-apply questions
- Binary output formats
- Randomization of items (to reduce bias)
- Balanced exposure when using subsets
2. Export Capabilities
The platform should allow for:
- Export to Excel or CSV
- Clean output without preprocessing
- Binary matrices or response tables
This is important for smooth integration with R, Python, or Displayr.
3. Built-in TURF or Analytical Integrations
Some survey tools may offer:
- TURF modules
- Built-in segmentation tools
- Visualization dashboards
If your tool lacks these features, consider exporting the data to a dedicated analytics platform.
4. User Guidance and Education
Encourage your users or clients to:
- Understand how to interpret TURF results
- Use TURF alongside other techniques
- Test combinations through A/B or live rollouts
A survey platform that provides educational content, templates, or analytical recommendations adds significant value.
Conclusion and Next Steps
TURF analysis is a robust technique that helps businesses and researchers determine the most effective combination of offerings to maximize unduplicated reach. By using structured survey design, binary survey responses, and clear data analysis, you can extract actionable insights that support better decisions.
Key Takeaways:
- TURF helps you select the optimal mix of products, features, or messages.
- It is best used when you cannot offer everything and need to prioritize.
- TURF is not a replacement for MaxDiff or Conjoint but complements them in the right context.
- Sound survey design and data preparation are critical for accurate results.
- Segmenting your analysis and balancing business constraints leads to better recommendations.
Next Steps:
- Review your current survey platform for TURF capabilities.
- Plan your next research project with binary response formats in mind.
- Use TURF to guide real-world decisions in product development, marketing, and UX.
- Consider combining TURF with other survey data analysis methods for deeper insight.
When used well, TURF analysis becomes more than just a calculation. It becomes a strategic asset that helps organizations do more with less, reach more people, and optimize offerings that actually matter.
