How to Analyze Open-Ended Survey Responses for Actionable Insights
When conducting surveys, businesses, researchers, and HR professionals often struggle with how to analyze open-ended survey responses effectively. Unlike closed-ended questions, which provide structured and quantifiable data, open-ended responses contain rich qualitative insights that require careful interpretation.
Analyzing open-ended responses helps uncover deeper themes, customer sentiments, and critical insights that can drive better decision-making. By extracting key themes, performing qualitative analysis of open-ended questions, and leveraging sentiment and cross-tab analysis, organizations can make sense of unstructured feedback in a meaningful way.
In this guide, we’ll cover:
- Why open-ended questions are valuable
- Common challenges in analyzing open-ended responses
- A step-by-step approach to conducting survey open-ended questions analysis visual
- The best tools for open-ended survey data analysis
- Real-world examples of actionable insights from surveys
Why Open-Ended Questions Matter in Surveys
Open-ended questions in surveys allow respondents to express their thoughts freely, providing deeper insights beyond predefined choices. They uncover valuable qualitative data, helping researchers understand motivations, emotions, and unique perspectives that multiple-choice questions might miss. Below are the key reasons why open-ended questions are essential in surveys:
1. Richer Qualitative Data
Open-ended survey questions allow respondents to express their thoughts freely, providing more detailed feedback than multiple-choice options. Unlike closed-ended data, which is easy to quantify, open-ended responses capture emotions, reasoning, and context behind opinions.
2. Use Cases of Open-Ended Questions
Organizations across different domains use open-ended survey questions to collect valuable feedback. Some key applications include:
| Survey Type | Purpose | Example Open-Ended Question |
|---|---|---|
| Customer Feedback | Understand satisfaction levels | “What do you like most about our product?” |
| Market Research | Gather qualitative consumer insights | “What features would you like in a new version?” |
| Employee Engagement | Assess workplace satisfaction | “What changes would improve your job experience?” |
| Product Development | Identify user pain points | “What challenges do you face using our software?” |
Challenges in Analyzing Open-Ended Responses
Analyzing open-ended survey question examples presents several challenges compared to structured survey data:
1. Handling Large Volumes of Data
When thousands of respondents provide text-based feedback, manually sifting through responses becomes overwhelming. Automated tools help streamline text analysis for large-scale surveys.
2. Subjectivity in Interpretation
Unlike numerical data, qualitative analysis of open-ended questions requires interpretation, which can vary between analysts. Consistency in coding and categorization is crucial for reliable insights.
3. Identifying Patterns Without Structure
Unlike closed-ended questions that produce straightforward statistics, open-ended survey questions generate unstructured responses that require advanced techniques like keyword extraction, sentiment analysis, and cross-tabulation to reveal meaningful trends.
Step-by-Step Guide: How to Analyze Open-Ended Survey Responses
1. Data Cleaning and Preparation
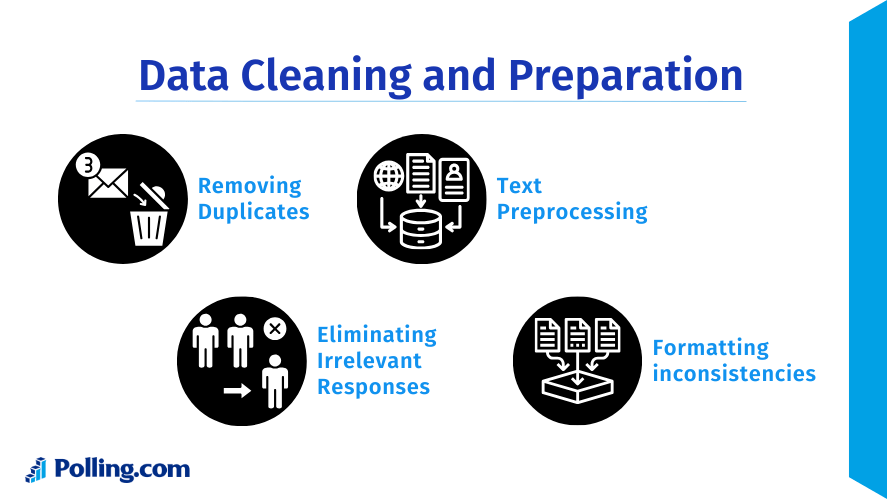
Before diving into survey data analysis, the first step is to clean and structure your responses. This includes:
- Removing duplicates – Avoid redundant responses that can skew analysis.
- Eliminating irrelevant responses – Filter out responses that don’t provide useful insights.
- Text preprocessing – Standardizing responses by correcting typos, removing stopwords, and using lemmatization.
- Formatting inconsistencies – Ensuring uniform text case and punctuation handling.
Tools for Data Cleaning:
- Python libraries like NLTK, TextBlob, and SpaCy
- Google Sheets formulas for text normalization
2. Extracting Common Themes
Once data is cleaned, the next step is identifying recurring themes in responses. Theme extraction helps categorize qualitative feedback into meaningful topics.
Methods for Theme Extraction:
| Method | Description | Example Use Case |
|---|---|---|
| Keyword Frequency | Identifies most commonly used words or phrases | Word clouds showing top concerns from customers |
| Topic Modeling (LDA) | Uses AI to group similar responses into topics | Clustering product feedback into categories like “performance” or “design” |
| Manual Categorization | Human-led classification of responses into pre-defined categories | HR team sorting employee feedback into “workload,” “culture,” etc. |
Example Word Cloud (Visual Suggestion):
A word cloud can be generated to display the most frequently mentioned words in survey responses.
3. Sentiment Analysis for Open-Ended Responses
Sentiment analysis helps classify responses into positive, negative, and neutral sentiments, enabling organizations to measure customer or employee satisfaction levels.
How Sentiment Analysis Works:
| Sentiment Type | Example Response | Interpretation |
|---|---|---|
| Positive | “I love the new update! The interface is much smoother.” | Users are happy with the update. |
| Neutral | “The latest product is okay, but I haven’t used it much.” | Users are indifferent. |
| Negative | “Customer support is slow and unhelpful.” | Dissatisfaction with support. |
Tools for Sentiment Analysis:
- TextBlob (Simple sentiment classification)
- VADER (Optimized for short text)
- Google Cloud Natural Language API (Advanced sentiment detection)
4. Cross-Tabulation of Sentiment and Themes
Cross-tabulation helps correlate different themes with sentiment, uncovering actionable insights.
Example: Cross-Tabulation of Sentiment and Themes
| Theme | Positive Sentiment | Negative Sentiment |
|---|---|---|
| Customer Support | 70% | 30% |
| Pricing | 20% | 80% |
| Product Features | 60% | 40% |
Insight: Customers are mostly dissatisfied with pricing but happy with customer support.
Visualization Suggestion:
Use bar charts in Power BI or Tableau to display the distribution of sentiment across different themes.
Best Tools for Analyzing Open-Ended Survey Data
Several tools make survey data analysis more efficient:
| Tool | Best For |
|---|---|
| Google Sheets & Excel | Basic survey data calculations |
| Python (NLTK, TextBlob, Pandas) | Advanced qualitative analysis of open-ended questions |
| Tableau & Power BI | Data visualization and dashboard reporting |
| MonkeyLearn | AI-powered text classification |
Practical Use Cases and Examples

1. Customer Survey Text Analysis
A retail company conducted an open-ended survey about customer experience. Using how to analyze survey data techniques, they found that “checkout experience” was frequently mentioned negatively, prompting improvements in their payment system.
2. Employee Feedback Analysis
HR departments use employee engagement survey open-ended qualitative analysis to understand workplace concerns. A tech company discovered that “work-life balance” appeared in many responses with negative sentiment, leading to policy changes.
3. Product Development Insights
A software company analyzing open-ended survey questions found that users frequently mentioned “missing integrations,” leading to a strategic roadmap update.
4. Brand Perception Analysis
A global beverage brand conducted a customer sentiment survey to assess brand perception. Open-ended responses revealed that customers associated their brand with “outdated advertising,” prompting a revamp in their marketing campaigns.
5. Market Research & Competitive Analysis
A startup used qualitative survey analysis to compare their product against competitors. By examining customer complaints about rival products, they identified gaps in the market and adjusted their pricing and features accordingly.
6. Public Opinion & Policy Making
Government agencies analyzing citizen feedback surveys found recurring mentions of “traffic congestion” and “public transportation issues,” leading to new urban planning initiatives.
7. UX & Usability Testing
A gaming company analyzed responses from beta testers and noticed frequent mentions of “confusing UI elements.” This led to a redesign of their navigation system before launch.
8. Academic Research & Social Studies
Researchers conducting sociological studies used open-ended survey responses to identify emerging societal trends, such as shifting attitudes toward remote work post-pandemic.
9. Healthcare & Patient Experience Analysis
A hospital surveyed patients about their treatment experience. The analysis revealed frequent mentions of “long wait times”, leading to improved scheduling systems and staff allocation.
10. Customer Support & Service Improvement
An e-commerce company analyzed post-support customer feedback. Many responses indicated frustration with “slow response times”, prompting an investment in AI-powered chatbots and extended support hours.
Conclusion
Analyzing open-ended survey responses is essential for uncovering deep insights that structured data alone cannot provide. By leveraging theme extraction, sentiment analysis, and cross-tabulation, businesses can turn unstructured text into actionable insights that drive real improvements.
To ensure accuracy and efficiency in how to do analysis of survey data, organizations should adopt AI-driven tools and advanced survey data calculations methods. Investing in the right methodologies and technologies will enhance decision-making and overall business strategy.
Ready to extract valuable insights from your survey responses? Start analyzing today with the right tools and techniques!