Cross-Sectional Surveys: Quick & Effective Data Collection Guide
Want to know what people think right now, without waiting months for answers? That’s where a cross-sectional survey steps in. It’s a fast, powerful way to snap a picture of opinions, behaviors, or trends at a single moment.
Whether you’re a researcher gauging voter sentiment or a business checking customer vibes, this method delivers quick and actionable data.
But pulling it off smoothly takes the right tools, and Polling.com is your go-to for simplifying cross-sectional survey design, with easy setup, real-time results, and analytics that cut through the noise.
This guide breaks down what is a cross sectional survey, why it’s a game-changer, and how Polling.com makes it a breeze for effective cross-sectional data collection.
What is a Cross-Sectional Survey?
To get why cross-sectional surveys are so handy, let’s unpack what they are, how they differ from other methods, and where they shine in the real world.
Cross Sectional Survey Definition and Core Characteristics
A cross-sectional survey is a research tool that collects data from a group of respondents at one specific point in time, like a snapshot of what people think or do right now.
Unlike studies that track changes over months, this method grabs a quick, broad view across different folks, say, 1,000 voters or 500 shoppers, to spot patterns.
Its core traits? It’s fast, covers diverse groups, and works as a survey at a single point in time. These traits make it perfect for cross-sectional survey research design that needs results yesterday.
Difference Between Cross-Sectional and Longitudinal Surveys
So, how’s a cross-sectional survey different from a longitudinal one? A cross-sectional survey is a one-and-done deal, like asking 2,000 people their favorite game genre in May 2025.
A longitudinal survey, on the other hand, follows the same group over time, like checking those gamers’ preferences every six months for two years.
Cross-sectional is quicker and cheaper, ideal for instant insights, but it can’t track trends like longitudinal studies can. For survey study design, the focus is on breadth, not depth over time.
Real-World Examples
Cross sectional survey examples pop up everywhere.
Picture a political poll asking 1,500 voters who they’d back in a June 2025 election, giving a clear read on public sentiment that week.
Or, imagine a retailer surveying 800 customers about holiday shopping habits in December 2025, spotting trends like 60% preferring online deals.
These snapshots, powered by a descriptive survey method like cross-sectional survey research, help campaigns pivot or brands plan fast.
When and Why to Use a Cross-Sectional Survey
Knowing when to roll out a prevalence study like a cross-sectional survey can make your data collection a slam dunk.
So, let’s dive into its best uses, perks, and a few quirks to watch for.
Ideal Use Cases
Cross-sectional surveys shine when you need a quick pulse on what people think at one moment.
They’re perfect for assessing public sentiment, like a city surveying 1,200 residents on park upgrades in July 2025 to guide budget talks.
Market snapshots are another win, say, a coffee chain checking 900 customers’ flavor preferences to launch a new drink.
Other great fits? Testing ad campaign reactions or gauging employee morale in a single shot, where cross sectional survey design delivers fast, broad insights without long-term tracking.
Benefits: Cost-Effective, Fast Data Collection, Ease of Analysis
Why choose a cross-sectional survey? It’s budget-friendly, often costing less than longitudinal studies since you’re not chasing respondents for months.
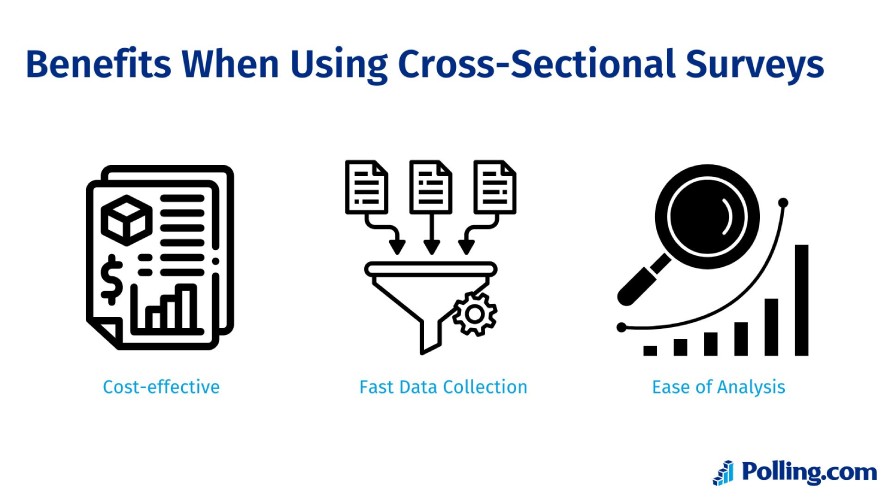
Data collection is lightning-fast, think days or hours with cross sectional survey study design on platforms like Polling.com, which churns out results in real time.
Analysis is a breeze too, with simple stats like percentages, giving clear answers, no complex trend models needed.
These perks make cross-sectional surveys a go-to for quick, impactful decisions.
Limitations and Considerations
But limitations of cross sectional surveys exist.
They can’t track changes over time, so if you want to see how opinions shift, you’re out of luck, unlike longitudinal surveys.
Causation is another blind spot. A survey might show 65% of happy employees work remotely, but it won’t prove remote work causes happiness.
Small or biased samples can also skew results.
So, cross sectional survey research needs solid design, like Polling.com’s tools for diverse, representative respondent pools, to dodge these pitfalls and keep your data legit.
How to Design an Effective Cross-Sectional Survey
Crafting a cross-sectional survey that delivers clean, reliable data takes some planning.
Start by defining clear objectives. Ask, “What do I need to know?”.
For example, a gym chain might want to know why 1,000 members visit less often in August 2025. Narrow it down, like focusing on class variety versus pricing, to keep your cross-sectional survey study design sharp.
Next, select a representative sample. Aim for diversity in age, gender, or location, say, 800 gym-goers across urban and rural areas, to avoid bias.
Tools like Polling.com’s respondent panels make this easy, pulling varied groups fast.
Then, create clear, concise questions.
Stick to 5–10 questions, mixing multiple-choice (How often do you attend classes?) with one open-ended (What’s one thing we could improve?) to balance survey analytics depth and speed.
Lastly, avoid leading questions, like “Don’t you love our gym?” to keep responses honest.
Best Tools to Create Cross-Sectional Surveys
Polling.com’s free poll maker shines here, offering drag-and-drop templates to build cross-sectional surveys in minutes, with real-time previews to catch hiccups.
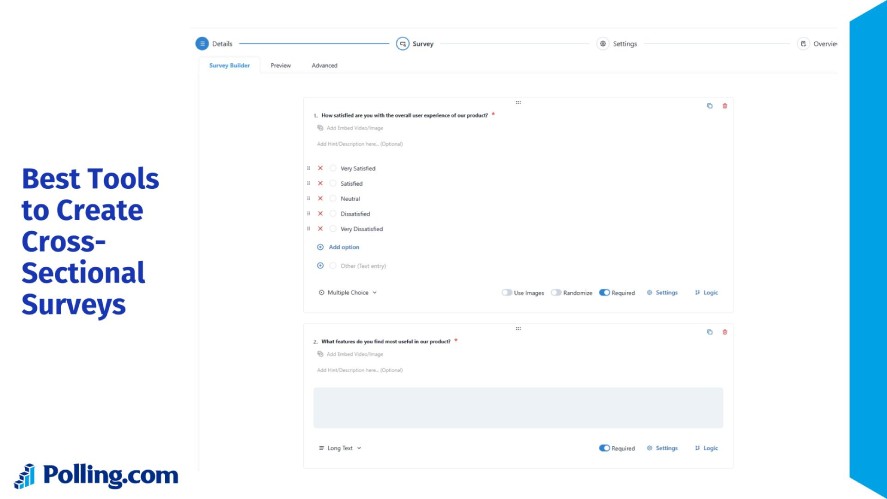
Compare alternatives, but Polling.com leads for cross sectional survey research.
Typeform’s flashy forms are great for engagement but lack respondent targeting. Google Forms is free yet basic, missing real-time analytics. SurveyMonkey suits enterprises but costs more.
Polling.com’s edge? Affordable plans, intuitive design, and bias-reducing features like randomized question order.
Best Practices For Designing a Cross-Sectional Survey
For best practices, test your survey on a small group, say, 50 respondents, to spot confusing questions.
Use anonymous options to boost honesty, and time surveys for max response, like evening sends for working adults.
These steps dodge limitations of cross sectional surveys, ensuring your design is rock-solid.
Analyzing Cross-Sectional Survey Results
Once your cross-sectional survey data rolls in, analyzing it right turns numbers into insights. Let’s break down how to make sense of your one-time population snapshot.
Start with descriptive statistics to summarize findings. Calculate averages or percentages, like finding 62% of 1,000 coffee shop customers prefer iced drinks in July 2025.
Segmentation digs deeper, split data by groups, say, urban versus rural customers, to see if city folks lean toward lattes (70%) while rural ones pick cold brew (55%).
Demographic comparisons, like age or income, reveal more, maybe younger customers (18–24) rate service higher.
How to Interpret Single-Point-in-Time Data
Interpreting single-point-in-time data means sticking to what the snapshot shows, don’t assume trends or causes.
If 65% of employees report high stress, you know it’s an issue in May 2025, but you can’t say stress is rising or caused by workload.
You need to cross-check with context, like recent company changes, to ground your cross sectional survey research.
Fortunately, Polling.com’s sentiment analysis helps here, flagging if “stress” ties to negative comments about deadlines.
Visualizing Results For Better Decision-Making
Visualizing results seals the deal for decision-making.
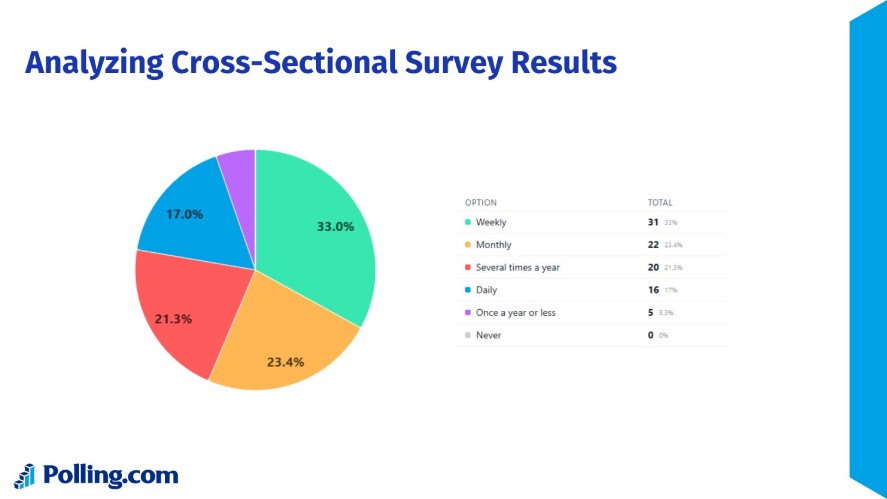
Bar charts showing 62% prefer iced drinks or pie charts breaking down age groups make insights pop. Polling.com’s dashboards auto-generate these, letting you export slick visuals for reports or pitches.
Clear visuals turn cross-sectional survey data into stories, like proving your coffee shop needs more cold brew stock, driving smarter, faster calls.
Cross-Sectional Surveys in Practice
Let’s explore how politics, healthcare, business, and education use cross-sectional surveys to make strategic moves, with illustrative case studies.
In politics, a cross-sectional survey can shape campaigns. Imagine a 2025 mayoral race where a candidate polls 2,000 city voters in June, finding 55% prioritize transit over housing.
This insight pivots their platform to focus on bus lane funding, boosting voter support. The snapshot guides messaging without needing months of tracking.
In healthcare, cross-sectional surveys inform resource allocation. Picture a hospital surveying 1,500 patients in August 2025, learning 70% want telehealth options.
This drives investment in virtual care, cutting wait times and lifting patient satisfaction. The quick data snapshot, despite limitations of cross sectional surveys like no trend tracking, fuels fast, impactful decisions.
For business, cross-sectional surveys spark market wins. Consider a tech startup surveying 900 users in July 2025, finding 65% prefer a simpler app interface.
This prompts a UI overhaul, boosting retention by 10%. The cross sectional survey example shows how a single poll can refine products without costly longitudinal studies.
In education, cross-sectional surveys improve learning. Imagine a college polling 1,200 students in September 2025, discovering 60% want more AI tool training.
This leads to new workshops, enhancing engagement. TThe non-longitudinal survey snapshot, though limited to one moment, drives curriculum tweaks.
These cases show how cross-sectional survey research turns quick insights into strategic decisions, from campaign pivots to patient care upgrades, leveraging tools like Polling.com for speed and clarity.
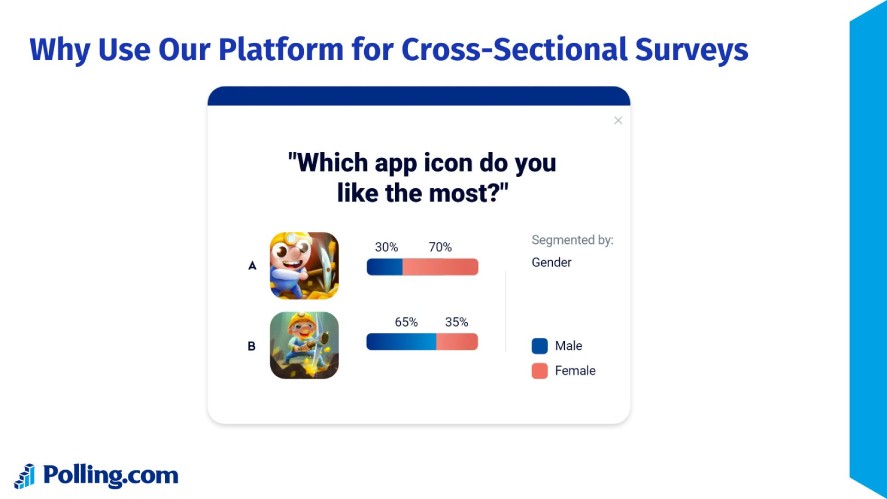
Polling.com Advantage: Why Use Our Platform for Cross-Sectional Surveys
When it comes to cross-sectional surveys, Polling.com stands out as the go-to platform for quick and reliable data collection.
Its free survey maker lets you craft surveys with drag-and-drop templates, launching a 10-question poll in under 10 minutes.
In addition, Polling.com’s anonymous options and mobile-friendly designs boost response rates, addressing limitations of cross sectional surveys like bias.
Real-time analytics are a game-changer. Polling.com’s dashboards show live results, like 68% of 800 voters backing a policy, with sentiment analysis flagging key themes, such as “safety” driving support.
Not only that, integration with tools like Salesforce or Google Sheets lets you pipe data into workflows fast. Exportable charts make presenting insights to stakeholders a snap, streamlining cross-sectional survey research.
Compared to others, Polling.com shines. SurveyMonkey offers solid analytics but lacks Polling.com’s cost-effective free tier and survey-specific respondent targeting.
Google Forms is free but too basic, missing real-time analytics or integrations. Qualtrics packs advanced features, like predictive analytics, but its steep price and complexity suit enterprises, not small teams.
Polling.com balances affordability, ease, and power, making it ideal for cross sectional survey example projects, from startups to researchers.
Conclusion
Cross-sectional surveys are your ticket to quick, actionable insights, capturing a moment’s worth of opinions, from voter priorities to customer preferences, without the wait.
Their practicality shines in politics, healthcare, business, and education, where a single snapshot drives big decisions, despite limitations of cross sectional surveys like no trend tracking.
Polling.com makes it all easier, with fast setup, real-time survey analytics, and integrations that turn cross-sectional survey research into a breeze.
Whether you’re a researcher or a business owner, start building effective cross-sectional surveys with Polling.com’s free tools today. Check out Polling.com’s templates and guides for more tips to level up your data game!