
Content Ideas You Can Generate From a Single Survey
You conduct a survey, get dozens, or even hundreds, of responses, but then comes the real question: what can you actually do with all that data?
Many marketers stop after publishing a single survey results post, missing out on the huge potential buried in those responses.
The truth is, a single survey can become a full-fledged content engine and one of the most effective content strategy planning tools if you approach it strategically.
Every question you ask can feed multiple pieces of content, from data-driven blogs and social snippets to infographics, case studies, and even podcast discussions.
In this article, you’ll learn how to design surveys that naturally generate content ideas, understand how to transform data into engaging stories, and follow a proven workflow to turn one set of survey responses into weeks of fresh, high-performing content.
Why One Survey Can Fuel Many Content Ideas
A well-designed insights survey isn’t just a tool for gathering opinions; it’s a goldmine for creating original, high-value content and evergreen content topics.
Let’s explore why content marketing surveys are one of the most efficient sources of marketing material.
Surveys = Rich Primary Data
Unlike recycled industry stats or secondhand research, survey responses give you original, first-hand insights that no one else has.
You get both quantitative data (numbers, percentages, rankings) and qualitative insights (opinions, stories, and motivations).
Open-ended answers reveal unexpected themes, while segmented responses show differences across groups, all of which can be turned into content that resonates deeply with your audience.
Leverage Data to Tell Stories
Raw numbers are valuable, but the real magic happens when you turn those numbers into narratives.
Each data point can anchor a story about your industry’s trends, challenges, or opportunities.
By analyzing differences across segments, such as experience level, company size, or region, you can create targeted content that speaks directly to subgroups of your audience.
That means more relevance, more engagement, and more authority.
Efficiency & ROI Gains
Creating high-quality content from scratch takes time, but survey data shortcuts the process.
You already have verified insights and authentic quotes to work with, so no need for endless brainstorming or external research.
Plus, when you publish content grounded in real data, you boost credibility and position your brand as a thought leader.
In short, every hour spent designing a survey pays off many times over in content ROI.
How to Design a Survey for Content Ideas Generation
If you want your survey to power an entire content campaign, you have to design it with storytelling in mind.
That means thinking beyond research and framing your content survey questions so the responses can naturally turn into blogs, visuals, or case studies later.
The goal isn’t just to collect answers; it’s to collect content-ready insights.
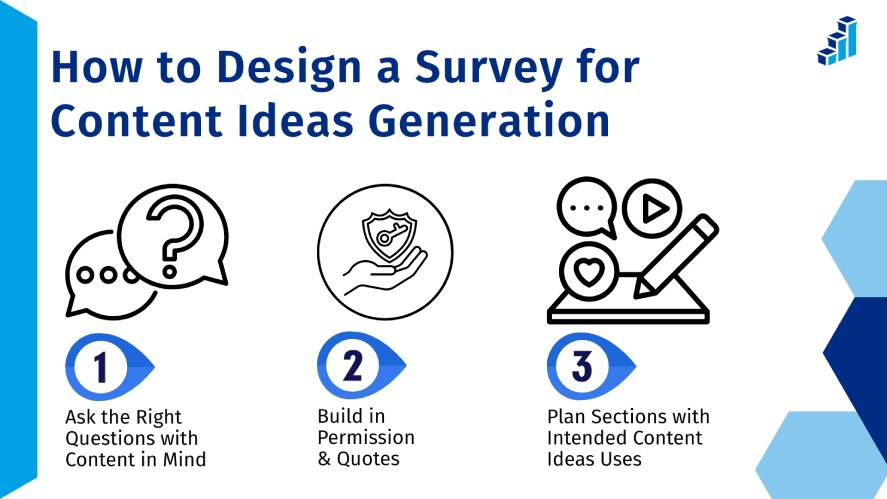
Ask the Right Questions with Content in Mind
Every good content survey starts with thoughtful question design.
Go beyond yes/no questions and ask for stories, comparisons, and opinions that can later be quoted or analyzed.
Next is mix question types. Use matrix questions and rating scales to gather measurable data, then follow them with “why” or “how” prompts to capture context and emotion.
This combination gives you both the numbers for data visuals and the quotes for storytelling.
Lastly, don’t forget to include a few segmentation or demographic questions (like industry, experience level, or location).
These let you break down your data later and create content tailored to each audience group. For example, “How small businesses answered vs. enterprises”.
Build in Permission & Quotes
One of the biggest missed opportunities in content surveys is failing to get quote permission.
If you plan to highlight real answers or case stories, ask for explicit consent in the form itself.
Add a short optional field like, “Can we feature your name and company in our survey results?” or “Would you be open to a quick follow-up interview?”.
You can even include a “share your story” question, as it invites passionate respondents to provide deeper insights you can turn into mini case studies or testimonials later.
This approach makes your final content richer and more human.
Plan Sections with Intended Content Ideas Uses
Before launching your content feedback survey, outline how each section will feed specific content types.
For example, one block of content marketing survey questions might fuel a blog post on emerging trends, another could produce data for an infographic, and a third might generate quotes for social media.
Planning this in advance ensures you’ll have the right mix of quantitative and narrative data to support every content format.
You’ll finish with not just a set of results, but a full roadmap of content ideas ready to publish across platforms.
Content Types You Can Create from One Survey
Once your survey data is in, it’s time to turn those responses into real, high-performing content.
The beauty of a well-designed survey is its versatility. You can repurpose the same set of insights into blogs, visuals, emails, and even live discussions.
Below are the most effective ways to turn survey data into a full content ecosystem that keeps your audience engaged across every channel.
Blog Posts & Articles
Your survey results are a goldmine for written content. Use them to:
- Publish trend reports showcasing top responses and emerging patterns.
- Write deep-dive articles focusing on specific audience segments or surprising insights.
- Create themed posts like “What respondents said about X” or “5 Lessons from our 2025 Industry Survey”.
These posts not only educate but also establish your brand as a credible thought leader backed by data.
Infographics & Data Visualizations
Visual content helps your audience grasp key takeaways at a glance. You can:
- Turn response distributions into colorful charts and graphs.
- Build comparison visuals showing how different segments answered.
- Design slide decks or summary visuals for internal reports, LinkedIn, or presentations.
Infographics make your insights shareable, perfect for boosting reach on social platforms and newsletters.
Social Media Snippets & Quotes
Social media thrives on snackable content. From your insight survey, extract:
- Short quotes, standout stats, or surprising takeaways to post on Twitter, LinkedIn, or Threads.
- Visual quote cards using respondents’ words (with permission).
- Mini polls or follow-up questions inspired by your findings to keep engagement going.
Each post can link back to your full report or blog, driving consistent traffic from multiple touchpoints.
Case Studies & Customer Stories
If your survey included open-ended questions, you’re sitting on a source of authentic stories.
With permission, you can:
- Feature mini case studies highlighting unique responses or innovative approaches.
- Showcase standout participants who represent key trends in your data.
These stories humanize your findings, helping readers connect emotionally with real people behind the numbers.
Downloadables & Lead Magnets
For long-term content value, repurpose your survey data into:
- Full whitepapers or research reports that position your brand as a data authority.
- PDF summaries, templates, or cheat sheets for quick takeaways.
- Slide decks or “state of the market” reports that attract leads through gated downloads.
These content ideas work perfectly for email opt-ins or campaign launches.
Email Series & Drip Campaigns
Your survey results can fuel weeks of engaging email content. Try:
- Breaking findings into short, themed newsletters, each covering one insight or trend.
- Segmenting your audience based on their interests or responses to deliver more relevant content.
It’s a great way to stay top-of-mind while keeping your subscribers informed with fresh, data-backed insights.
Webinar/Podcast Episodes
Finally, use your survey results to power interactive or long-form discussions, like:
- Host a webinar diving into your key findings, inviting respondents or experts to share their perspectives.
- Record a podcast episode that explores the survey’s implications for your industry.
This type of live or conversational content not only amplifies your survey’s reach but also fosters a sense of community around your insights.
Read More: How to Increase Survey Response Rate: 10 Proven Techniques
Workflow & Content Calendar from Survey to Publication
Once your survey responses start rolling in, the real work and opportunity begins, from survey data analysis to mapping insights into your content creation workflow.
To turn raw data into polished, high-performing content, you’ll need a clear workflow and a structured publishing plan.
A good process ensures that nothing goes to waste and that every insight finds its best format.
The timeline typically follows this flow:
Survey → Data Cleaning → Initial Analysis → Chunking Findings by Content Type
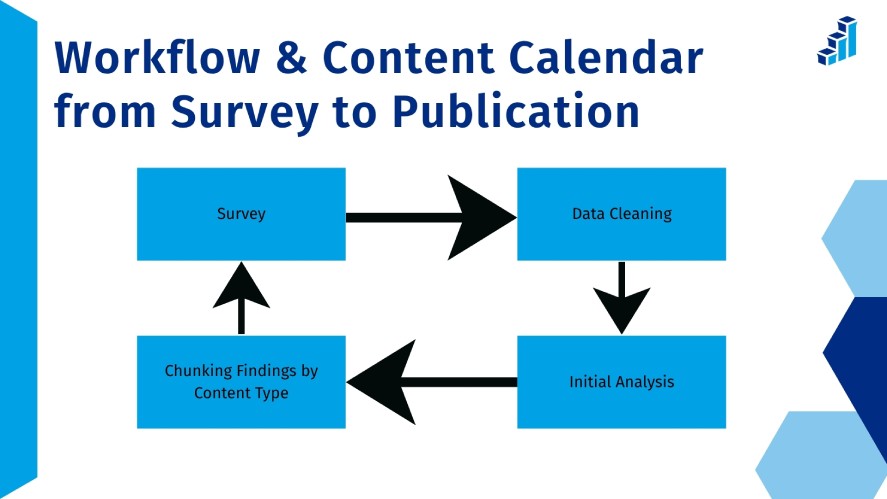
Start by cleaning and organizing your data to remove incomplete or duplicate responses. Then, analyze results to identify major themes, outliers, or surprising patterns.
From there, “chunk” your findings, grouping data into sections that naturally lend themselves to blog posts, visuals, or other formats.
Next, assign each content piece a place in your editorial calendar.
For example, publish the main survey report first, followed by smaller spin-off pieces like infographics or quote-based social posts in the weeks after.
This staggered approach keeps your campaign active over time and maximizes engagement.
Don’t forget to cross-link between all your outputs.
Your infographic should link to your blog post, your blog to your whitepaper, and your email series should reference them all.
Finally, use teaser quotes and stats in your social media or newsletters to drive traffic back to your main content hub.
With this workflow in place, your content strategy survey won’t just produce a single piece of content; it will anchor an entire publishing cycle that keeps your audience returning for more.
Best Practices and Pitfalls When Generating Content Ideas From Surveys
Before you dive into publishing, it’s crucial to handle your survey data responsibly and strategically.
Here are a few best practices and pitfalls to avoid to make the most of your survey-driven content.
First, ensure your sample is representative before making sweeping claims.
It’s tempting to turn every finding into a headline, but small or skewed samples can mislead readers and harm credibility.
Second, protect respondent privacy by anonymizing sensitive data or quotes. Always double-check permissions before publishing direct feedback or identifiable details.
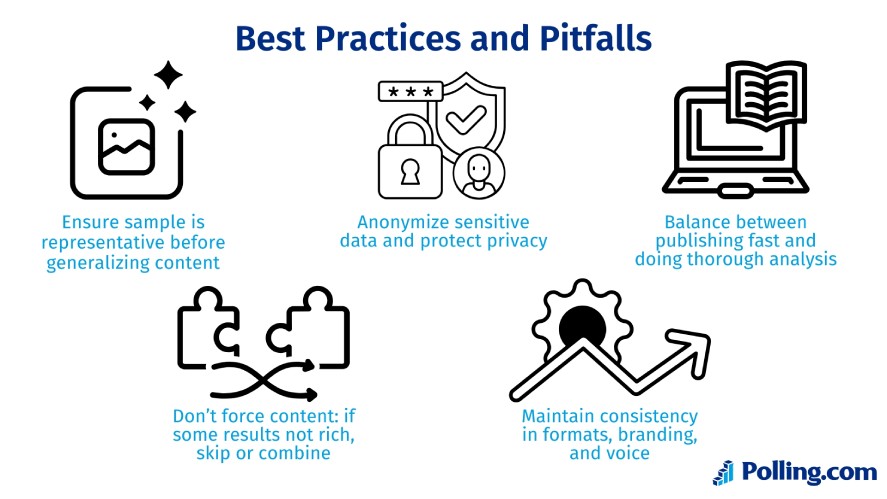
Next, strike a balance between speed and accuracy.
While it’s smart to publish results while they’re still relevant, rushing content analysis of survey responses can lead to shallow or incorrect conclusions.
So, take the time to verify your data and find genuine insights worth sharing.
Avoid the trap of forcing content where the data doesn’t support it.
If certain questions didn’t yield valuable results, skip or merge them into broader themes instead of stretching weak data into filler content.
Lastly, maintain consistency in your formats, branding, and tone of voice across every piece.
Whether it’s a data report, infographic, or podcast episode, your audience should instantly recognize it as part of the same survey campaign.
Handled correctly, your content analysis survey becomes more than a one-off project; it’s a sustainable, credible source of content that strengthens your brand’s authority and audience trust.
Examples & Case Studies
To see how a single survey can turn into a full-fledged content strategy, let’s look at a few real-world style examples of how different organizations repurpose their survey data.
Example 1: Software Company – From Feature Feedback to Marketing Assets
A SaaS company conducts a feature feedback survey to learn what tools users value most.
From the results, the team creates a blog post summarizing the most requested features, an infographic showing how usage differs between free and premium users, and testimonial quotes for their website and product pages.
Each content piece links back to the original report, reinforcing the company’s commitment to listening to its users.
Example 2: E-commerce Brand – Turning Customer Satisfaction into Educational Content
An online retailer surveys customers about purchase satisfaction and delivery experience.
The insights reveal recurring pain points: slow shipping and unclear sizing charts.
Instead of treating this as internal feedback only, the brand builds a content series around these topics: a blog post addressing sizing accuracy, a guide on shipping policies, and a short email campaign with “tips for a smoother shopping experience”.
The result? Transparency, authority, and stronger customer trust.
Example 3: Online Community – Engaging Members Through Shared Insights
A gaming community runs a simple content creator survey asking players about their favorite titles and playtime habits.
The community survey data results become a summary post of top-voted games, social media cards featuring fun stats, and a live Q&A session where moderators discuss trends with members.
This approach not only fuels content but also deepens engagement, giving participants a sense of ownership in the community’s narrative.
Conclusion & Next Steps
A single survey can do far more than deliver insights; it can power an entire content ecosystem.
When planned strategically, each question you ask becomes a seed for multiple content ideas: articles, infographics, podcasts, and even community discussions.
So the next time you design a survey, think beyond survey method of data collection. Ask yourself: What stories could these answers tell? What visuals or guides could they inspire?
And when you’re ready to turn your next survey into a content engine, use Polling.com’s survey templates to get started.
Map your questions to content outputs, gather responses, and watch as one survey becomes the foundation for months of meaningful, data-driven storytelling.