
Survey Sample Size Calculator: Get Your Sample Estimate
Ever wondered how many people you actually need to survey to trust the results?
It’s one of the most common questions in survey research, and one of the most important. The answer isn’t guesswork; it’s math.
In this guide, you’ll learn how to calculate the right survey sample size for your project.
We’ll walk through the logic behind the numbers, explain the inputs you’ll need, and give you an interactive survey sample size calculator that does the heavy lifting for you.
Why does this matter? Because choosing the wrong sample size can ruin your research.
Too few responses and your results lack reliability, undermining the purpose of survey research, answering what is the purpose of a survey in the first place.
But too many, and you waste time and money with little added benefit.
This article will help you strike the perfect balance so every response counts.
Why Sample Size Matters
Your sample size is the foundation of survey accuracy.
When it’s too low, the results are often misleading, as data becomes noisy, confidence intervals widen, and bias creeps in.
For example, if you run a customer satisfaction survey with only 30 responses, one extreme opinion can drastically skew the results.
On the other hand, going too big isn’t always better.
Collecting thousands of responses when a few hundred would do can drain your budget and delay decision-making, with little improvement in precision.
This is the classic case of diminishing returns.
The key is finding balance: enough responses to make confident decisions, but not so many that you overspend.
For instance, most studies show that around 300 responses can give you a ±5% margin of error at 95% confidence for large populations, which is a sweet spot in many business, health, and social research contexts.
The Key Inputs You’ll Need For The Survey Sample Size Calculator
Before you dive into the sample size for survey calculator, it helps to understand the key inputs that determine your results.
These variables shape how precise, reliable, and cost-effective your survey will be.
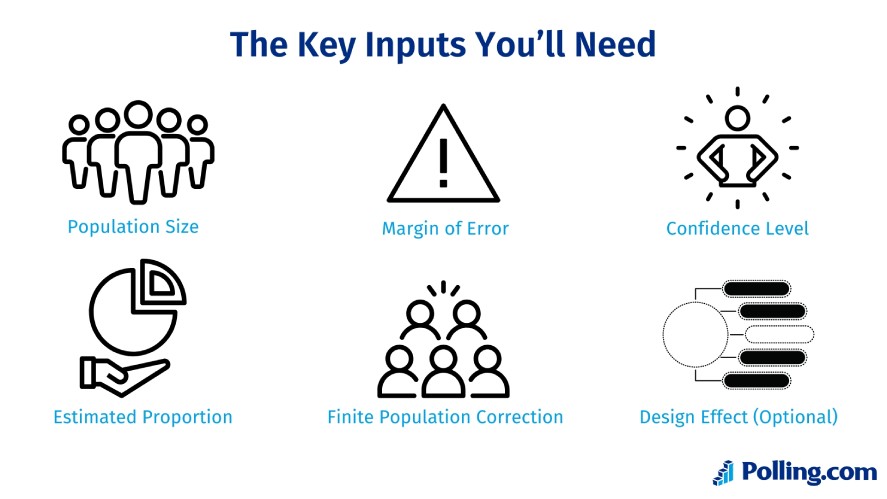
Population Size (N)
Population size is the total number of people you could survey.
If your target group is small and specific (say, 5,000 customers), population size matters.
For very large populations (tens of thousands or more), it has less effect because the math treats it as “effectively infinite”.
Margin of Error (E)
Expressed as ±X%, MoE tells you how much your survey results can deviate from the true population value.
A ±5% margin is common for business surveys; ±3% is tighter but requires more survey responses.
Confidence Level
This is how certain you want to be about your results, typically 90%, 95%, or 99%.
A 95% confidence level in surveys (with a Z-score of 1.96) is the most widely used standard.
Estimated Proportion (p or p̂)
Since you’re often estimating the percentage of people who will respond a certain way, this is your best guess.
If you’re unsure, use 50% (0.5).
It’s the most conservative estimate and gives the largest sample size needed, which is your worst case.
Finite Population Correction
If your population is relatively small, you can adjust the survey sample size calculation so you don’t oversample.
For example, surveying 400 people out of a pool of only 1,000 would be excessive without correction.
Design Effect (Optional)
If your survey uses clustering, stratification, or other complex designs, you’ll likely need to multiply your base sample size by a “design effect” to maintain accuracy.
Getting these inputs right ensures the sample size for survey calculator gives you results you can rely on.
The Formula (Behind the Scenes)
While the online survey calculator does the heavy lifting, here’s the math behind it so you can trust the results.
For large populations (infinite case), the formula is:
n0 = (Z^2 * p * (1 – p)) / E^2
Where:
- n₀ = initial sample size estimate
- Z = z-score (e.g., 1.96 for 95% confidence)
- p = estimated proportion (e.g., 0.5 if unknown)
- E = margin of error (as a decimal, so 0.05 for 5%)
For finite populations, apply the correction:
n = n0 / (1 + (n0 – 1) / N)
This adjustment prevents oversampling when the population size isn’t massive.
Why use p = 0.5? Because it maximizes variability, giving the largest required sample size. If your actual proportion is closer to 0 or 1, you can often get away with fewer responses.
Worked Example
Let’s say you want to know how to calculate survey size for survey projects with 10,000 people with a 95% confidence level (Z = 1.96), ±5% margin of error, and p = 0.5.
n0 = (1.96^2 * 0.5 * (1 – 0.5)) / 0.05^2 = 384.16
After rounding up, you’d need 385 responses, which is a classic benchmark for many surveys.
Interactive Survey Sample Size Calculator
Before you dive into the Polling.com’s survey sample size calculator, keep in mind that the number you get is only as good as the assumptions behind it.
This tool gives you a quick, statistically sound estimate, but you’ll still need to account for real-world challenges like nonresponse or messy sampling.
Use the result as your starting point — not the final word.
Survey Sample Size Calculator
How to Interpret & Use the Results
Once you have your recommended sample size, the next step is making sure it works in practice.
It’s often best to round up or add a buffer, since not everyone you reach will respond.
For instance, if you expect only a 50% average survey response rate, you should plan to invite twice as many participants to hit your target.
Think of the calculator’s number as your baseline.
You may need to adjust it depending on survey goals, whether that’s applying quotas, stratifying your sample for balance, or allowing for dropouts over time.
With client survey software, you can also automate reminders and track completion rates.
Also remember: sample size alone doesn’t guarantee accuracy.
Strong results come from pairing the right number of responses with careful sampling methods, clear survey design, and thoughtful analysis.
Finally, when communicating results, explain what “margin of error” really means in plain terms so stakeholders don’t over- or under-interpret your findings
Advanced Topics & Edge Cases
If you’ve already mastered the basics, there are a few advanced considerations that can significantly affect sample size planning, and using modern survey and polling software can help manage these complexities while keeping your methods statistically sound.
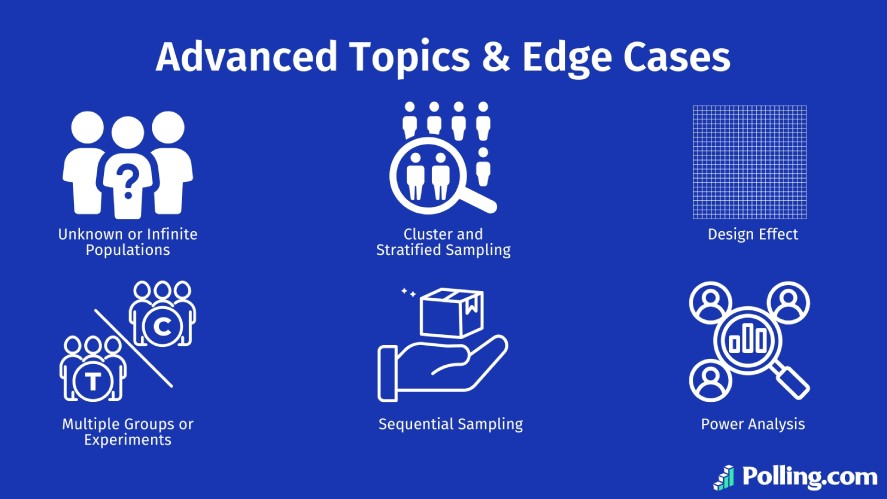
- Unknown or Infinite Populations: When the total population isn’t clear (like surveying website visitors), you can treat it as “effectively infinite” and rely on the large-population formula.
- Cluster and Stratified Sampling: If you group respondents or ensure representation by subgroup, you’ll often need to adjust your calculations. Stratification can improve precision, while clustering typically requires inflating sample size.
- Design Effect: Surveys using clusters (e.g., households instead of individuals) can suffer from intra-cluster correlation, meaning answers are more alike than expected. A “design effect” multiplier (Deff) corrects this by increasing the sample size.
- Multiple Groups or Experiments: Comparing subgroups or running A/B/C tests? You’ll need enough respondents per group to detect meaningful differences, not just for the whole sample.
- Unknown vs. Estimated Proportion (p): If you don’t know the proportion you’re measuring, assume 50% for a conservative baseline. If you have prior data, you can use it to lower required sample size.
- Sequential Sampling: Some advanced studies use stopping rules, like collecting data in waves and stopping once results stabilize. This can save resources but requires careful planning.
- Power Analysis: When your goal is comparing groups rather than just estimating a proportion, power analysis ensures your sample is large enough to detect real differences.
These considerations are more technical, but they highlight how flexible and nuanced sample size planning can be beyond the plug-and-play basics.
Common Mistakes & FAQs
Even with a solid formula, survey planning often goes off track because of avoidable errors.
Here are the big ones and how to fix them.
Mistake 1: Using p = 0 or 1 in The Formula
If you assume everyone will answer the same way, your sample size drops to zero, which obviously doesn’t work.
Solution: If you don’t know the proportion, always use p = 0.5 (50%). This is the most conservative estimate and ensures your sample is large enough.
Mistake 2: Forgetting to Adjust For Response Rate
Planning for 300 completed surveys but only inviting 300 people almost always leads to fewer responses than you need.
Solution: Estimate your likely response rate (e.g., 30–50%) and oversample accordingly. If you need 300 responses and expect a 50% response rate, invite at least 600 people.
Mistake 3: Choosing Unrealistic Precision Levels
Aiming for ±1% margin of error at 99% confidence sounds great, but it could require tens of thousands of respondents, which is more than most budgets allow.
Solution: Stick with industry standards (±5% margin, 95% confidence) unless your study demands more. Balance precision with cost.
Mistake 4: Ignoring Finite Population Correction
If your population is small (like 500 customers) but you calculate as if it’s infinite, you’ll end up overshooting the sample size.
Solution: Apply the finite population correction (FPC) if your population is relatively small or you’re surveying a big fraction of it.
Mistake 5: Misusing Skills or Tools
Even the right formula can mislead if you don’t think about quotas, stratification, or survey design.
Solution: Treat sample size as a starting point. Pair it with good sampling practices (like ensuring demographic balance) for trustworthy results.
Frequently Asked Questions
Sometimes, but it depends on your population size, margin of error, and confidence level.
Then you don’t need hundreds of responses. In fact, you can often survey the entire population (a census).
Yes, and most survey companies or any professional survey company use similar adjustments.
Summary & Call to Action
In this guide, you’ve learned why sample size matters, what the key inputs are, how the formulas work, and how to interpret your result.
The survey sample size calculator turns all that reasoning into a simple tool you can use at a moment’s notice. Use it as your starting point, then adjust your plan by oversampling or applying design corrections.
If you found this useful, bookmark or share this page so others can benefit too.
And when you’re ready to run your survey, try Polling.com tools or explore our suite of analytics, polling, and free business analytics software, alongside NPS survey tool resources.
Want to go deeper? Check out our blog for advanced sampling articles, webinars, and methodological case studies.
References & Further Reading
- Sample Size Determination: A practical guide
- Qualtrics sample size guide
- Survicate survey sample size explanation
- SmartSurvey blog on sample size importance
- How to Calculate Sample Size and Why
- Survey and Polling methodologies