Survey Data Quality: How to Get Accurate Results
Survey data is only as good as the decisions it drives. Inaccurate or misleading responses can lead to costly mistakes, like launching the wrong product, misreading customer sentiment, or basing public policy on faulty insights.
When survey data quality is poor, the consequences ripple outward: businesses lose money, brands lose trust, and institutions lose credibility.
The good news? You can prevent this. Whether you’re running a customer satisfaction poll, a political opinion tracker, or internal employee feedback, ensuring high quality data starts with smart survey design.
What Is Quality Data in Survey?
Quality survey data refers to responses that are accurate, reliable, and actionable. It’s the difference between making confident, data-driven decisions and being misled by noise or bias.
Quality data reflects genuine user opinions or behavior, captured in a way that’s free from distortion, manipulation, or error.
In practical terms, quality data is:
- Accurate: Respondents understand the questions and answer truthfully.
- Consistent: Patterns align across similar questions or respondent groups.
- Relevant: The responses are directly tied to the survey’s objectives.
- Clean: Free of straight-lining, random clicking, or contradictory answers.
High-quality survey data doesn’t just happen; it’s a result of applying strong data quality principles at every stage: from survey design to distribution, and all the way through to validation and analysis.
The payoff? Reliable survey results you can confidently use to guide decisions, improve products, or shape policy.
7 Tips to Avoid Bias For Survey Data Quality
Below are 7 actionable tips to improve your survey data quality, drawn from survey design best practices and powered by tools like Polling.com, which simplifies logic, structure, and respondent targeting.
1. Define Clear Objectives for the Survey
Before writing even a single question, you need a crystal-clear understanding of what you want to learn.
Are you trying to identify why users churn? Measure public opinion on a policy? Benchmark employee satisfaction?
Clear objectives are the compass that keeps your survey focused and relevant. Without them, you risk collecting survey data that looks impressive but says nothing useful.
For example:
- Vague goal: “Learn how users feel about our app”.
- Clear goal: “Determine which features drive satisfaction among weekly active users”.
Clear goals not only guide your questions but also align with core data quality principles, ensuring your survey remains focused, measurable, and results-oriented.
With Polling.com’s custom survey builder, you can structure your entire survey flow around specific objectives, whether for political research, market segmentation, or product testing.
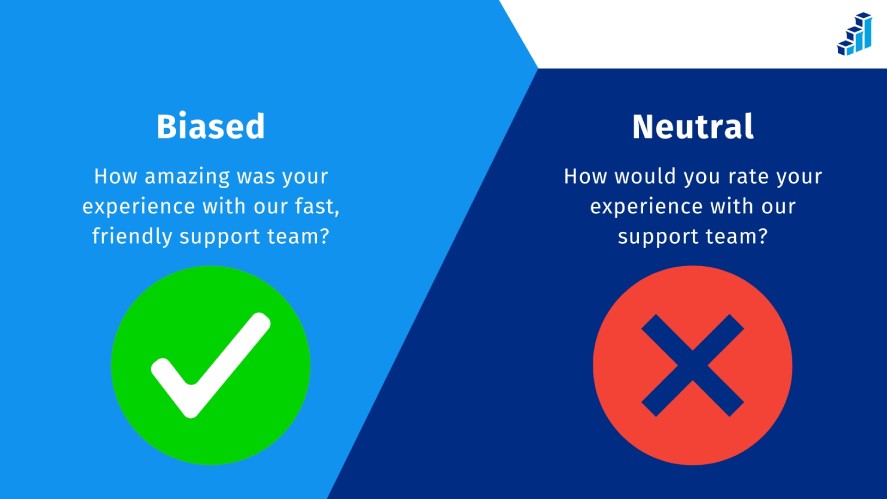
2. Craft Unbiased and Neutral Survey Questions
Even well-intentioned surveys can go off course without eliminating survey bias in the design process.
A leading question pushes respondents toward a specific answer. A loaded question assumes something untrue. A double-barreled question asks two things at once.
Let’s look at examples:
- Biased: “How amazing was your experience with our fast, friendly support team?”
- Neutral: “How would you rate your experience with our support team?”
- Loaded: “Why did you stop using our app so suddenly?”
- Neutral: “Have you stopped using our app?”
- Double-barreled: “Do you find the app useful and easy to navigate?”
- Split: “Do you find the app useful?” / “Do you find the app easy to navigate?”
To improve neutrality, use tools like AI grammar checkers, or have peers review questions for clarity and fairness. The cleaner the phrasing, the cleaner the survey data.
3. Target the Right Audience Segment
No matter how well-crafted your questions are, surveying the wrong audience will derail your data qualities.
If you’re gathering feedback on a new fintech app, but half your respondents are unfamiliar with online banking, your insights will be misaligned at best, and useless at worst.
That’s why targeting the right audience is crucial.
Demographic filters (age, income, location) and psychographic traits (habits, attitudes, lifestyle) help ensure you collect high-quality respondent data from people who actually represent your user base.
Tools like Polling.com offer advanced audience targeting features, letting you define exactly who receives your survey so you can cut through the noise and capture high-intent, relevant responses.
4. Use Randomization and Rotation For Better Survey Data Quality
Survey design isn’t just about what you ask; it’s also about how you ask it.
Order bias occurs when the position of a question or answer choice influences responses, leading to skewed survey data.
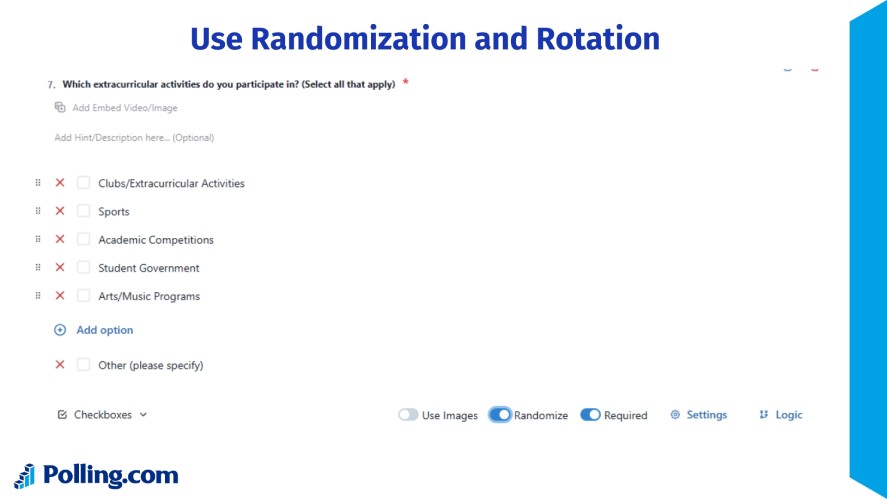
For example, always listing “Option A” first may cause more people to select it simply due to its placement. That’s where randomization and rotation come in.
By shuffling the order of multiple-choice options or rotating question blocks, you reduce bias and maintain data integrity in surveys.
Platforms like Polling.com, SurveyMonkey, and Qualtrics support these features natively, helping you gather cleaner, more objective insights.
5. Pre-Test or Pilot Your Survey
Even the best-designed surveys can suffer from ambiguous language, technical bugs, or confusing logic paths. That’s why pre-testing (also known as running a pilot survey) is a must before full deployment for survey data gathering.
A small test run with a sample of your target audience can uncover unclear wording, broken skip logic, or even mobile display issues that may otherwise go unnoticed.
For instance, a pilot might reveal that a key demographic is misinterpreting a satisfaction scale or that a key follow-up question isn’t triggering properly.
With Polling.com, you can preview your survey exactly as respondents will see it and even launch a mini pilot using its built-in testing tools. It’s a quick way to catch flaws and boost overall survey reliability.
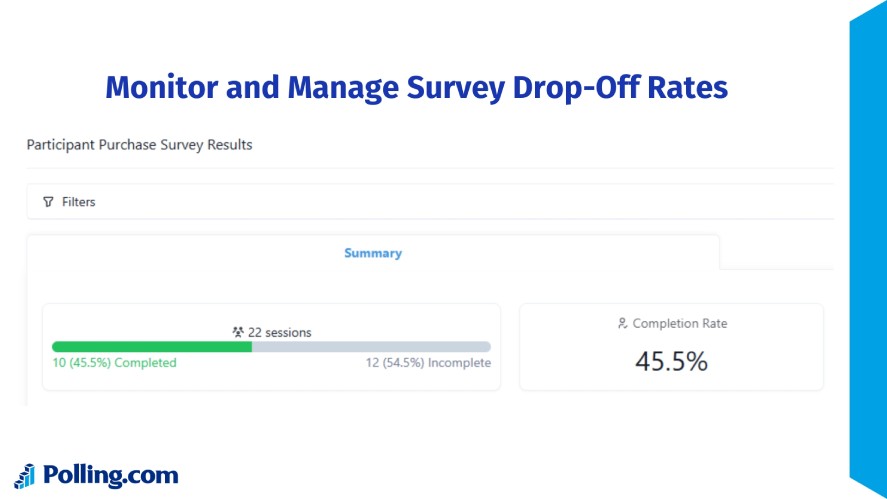
6. Monitor and Manage Survey Drop-Off Rates
A high drop-off rate, where respondents start but don’t finish your survey, is a red flag. It can signal issues like survey fatigue, confusing questions, poor mobile experience, or simply too many steps.
Monitoring this metric helps identify friction points in your survey flow.
One effective way to reduce drop-offs is by optimizing length: keep surveys concise, avoid redundant questions, and maintain a logical order.
Clarity and user experience matter just as much.
With Polling.com’s real-time analytics dashboard, you can spot exactly where users abandon the survey and make adjustments instantly. This means fewer incomplete responses and better-quality data overall.
7. Validate and Clean Your Survey Data
Collecting responses is just the beginning; maintaining clean survey data is where response accuracy is won or lost.
Survey response validation involves identifying low-effort answers like straight-lining (selecting the same answer repeatedly), contradictory responses, or speeders who rush through without reading. If left unchecked, these skew results and weaken your conclusions.
To protect your insights, it’s essential to go beyond surface-level checks.
Use behavioral analytics to detect deeper response patterns, like habitual answering behavior, where respondents always choose the same scale point (e.g., the middle option).
Pair that with user intent signals such as time spent per question or the quality of open-ended answers to flag and filter out low-quality data.
With Polling.com, quality checks on data are built-in: the platform automatically flags suspicious patterns for manual review, helping you maintain high standards without combing through raw data manually.
Best Practices for Maintaining Survey Data Quality
Creating high-quality survey data requires more than just crafting good questions; it demands an intentional, methodical process from start to finish.
Here’s how to ensure your data stays clean, reliable, and ready for analysis.
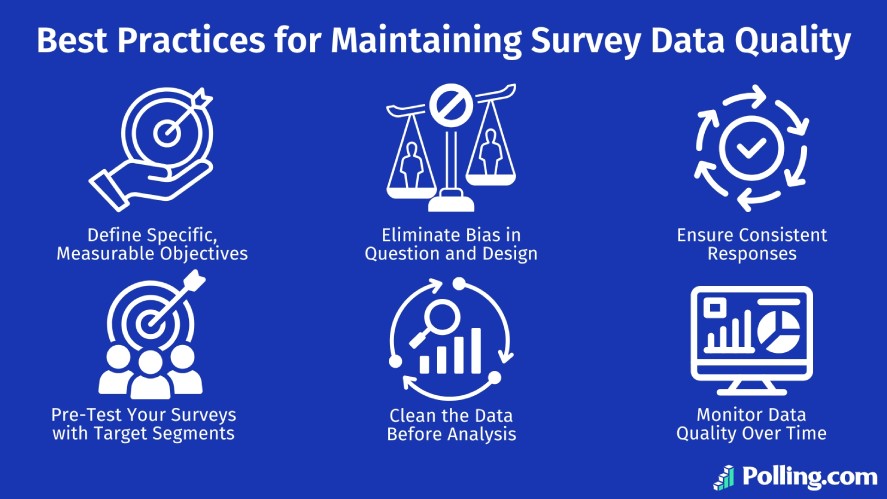
Define Specific, Measurable Objectives
Start with a clear purpose. What exactly do you want to learn from this survey?
A focused goal helps you build relevant questions that lead to actionable insights. Vague surveys often produce vague answers.
Instead of asking “What do you think about our product?”, aim for “What features are most valuable to users who signed up in the last 30 days?”.
Eliminate Bias in Question Wording and Design
The way you phrase questions can unintentionally guide responses. So, avoid leading language, double-barreled questions, or emotionally loaded terms.
For example, “How much do you love our amazing support team?” is less reliable than “How satisfied are you with the support you received?”.
A neutral tone and balanced wording create space for honest feedback.
Ensure Consistent Responses Through Logic and Randomization
Improve data consistency by adding logic branching (also called skip logic) and randomizing answer orders.
This reduces order bias and keeps questions relevant to each respondent. It also acts as a soft quality filter, as respondents who rush through illogical paths or skip conditional fields can be flagged during cleaning.
Pre-Test Your Surveys with Target Segments
Before rolling out your survey at scale, run a small pilot with your intended audience. This test helps uncover confusing wording, broken logic, or unexpected interpretation of questions.
Pre-testing is one of the most overlooked steps, and is also one of the most effective ways to catch flaws early.
Clean the Data Before Analysis
After responses are in, the real work begins. Look for “straight-lining” (selecting the same response across a scale), contradictory answers, or unusually fast completions.
These often signal low-effort responses that skew your insights. With tools like Polling.com, you can automate this review, flagging responses that fall outside behavioral norms.
Monitor Data Quality Over Time
Data quality isn’t a one-time concern. Watch long-term metrics like drop-off rates, time-on-question averages, or changes in open-text response depth.
These indicators help you spot survey fatigue, user confusion, or patterns of disengagement so you can make adjustments as needed.
Conclusion: Build Trust with High Survey Data Quality
In today’s data-driven world, the survey data quality insights can shape major decisions, from product launches to political strategies.
That’s why it’s essential to minimize bias, target the right audience, and clean your survey data collection thoroughly.
Tools like Polling.com are designed to support these best practices out of the box, giving teams a smarter way to collect, manage, and trust their survey data analysis.
If you’re ready to turn messy feedback into meaningful strategy, start building your next high-quality survey on Polling.com today.