2024 Presidential Election Predictions: U.S. Voter Trends
Although Polling.com is not traditionally focused on political polling, we embraced the excitement of the 2024 election cycle to conduct an internal study exploring voter intentions and opinions.
The 2024 presidential election promises to be a pivotal moment in U.S. history, with a range of voices and changing sentiments across the country. Through our internal survey, we’ve aimed to capture some of the nuances and shifts in voter perspectives that are shaping the current landscape.
Methodology and Sample Overview for the 2024 Presidential Election Predictions
Our approach to gathering data was straightforward, designed to engage a broad array of participants while minimizing biases as much as possible.
Over the past 100 days, we gathered approximately 1,300 responses, with 851 participants based in the United States. A preliminary view of the unfiltered, global data is available [here].
The sample was collected across several tool-based platforms that skew slightly male (~55%) with an average age of around 33 years, yielding a sample that, while not perfectly representative, captures aspects of the broader U.S. demographic. Notably, respondents were not offered incentives for their participation.
2020 Voting Patterns: Historical Comparison
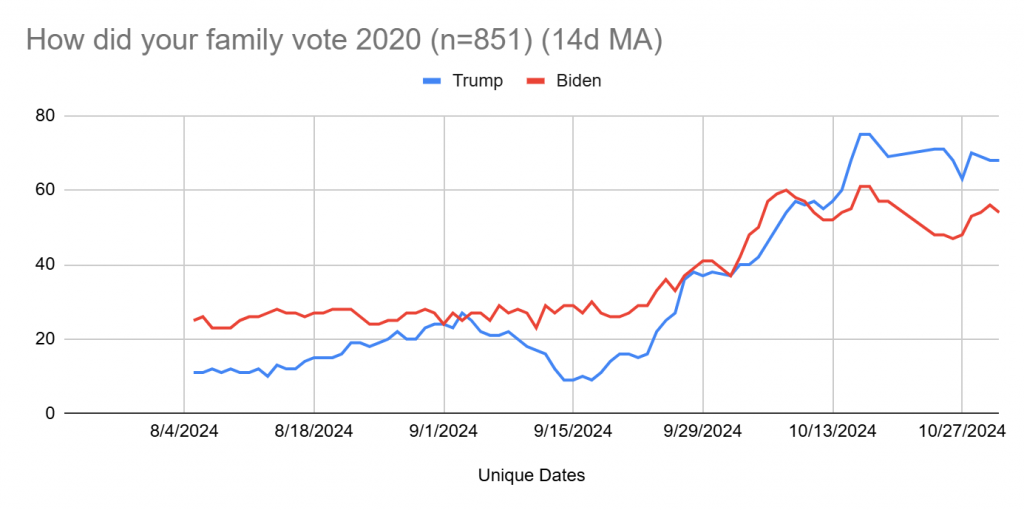
The initial question asked respondents to identify how their families voted in the 2020 election, providing a basis for comparative analysis. To mitigate sample noise, we used a 14-day moving average, which revealed an upward trend in responses from those who previously voted for Trump.
This question provided insight into political continuity within families, highlighting support trends and factors influencing voter allegiance. By using 2020 data as a baseline, we created a reference point to interpret expected shifts in 2024 voting behavior.
Anticipated 2024 Voting Intentions for the Presidential Election Predictions
Observing Voter Shifts
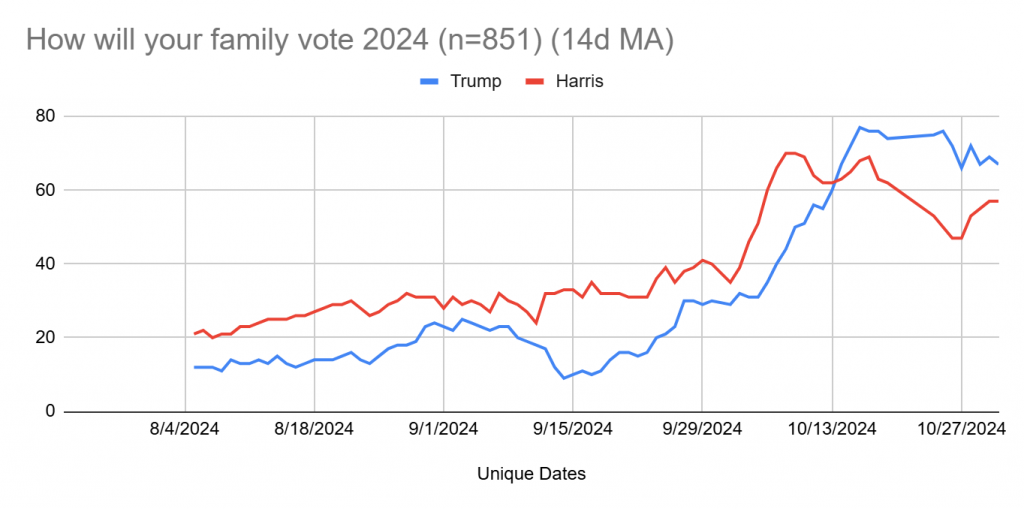
Next, we asked respondents how they anticipated their families would vote in 2024, observing a similarly increasing trend in Trump-supporting participants. Comparing responses between the 2020 and anticipated 2024 vote patterns also offered insights into voter shifts. This shift illustrates the complex and dynamic nature of voter behavior, reflecting potential factors like policy perspectives, economic conditions, and personal experiences over the past four years.
Analyzing these shifts allows us to identify broader trends in political attitudes. Whether these changes stem from policy preferences, economic impacts, or personal values, they reveal how respondents’ opinions may impact their voting intentions in 2024.
Party Switching Analysis
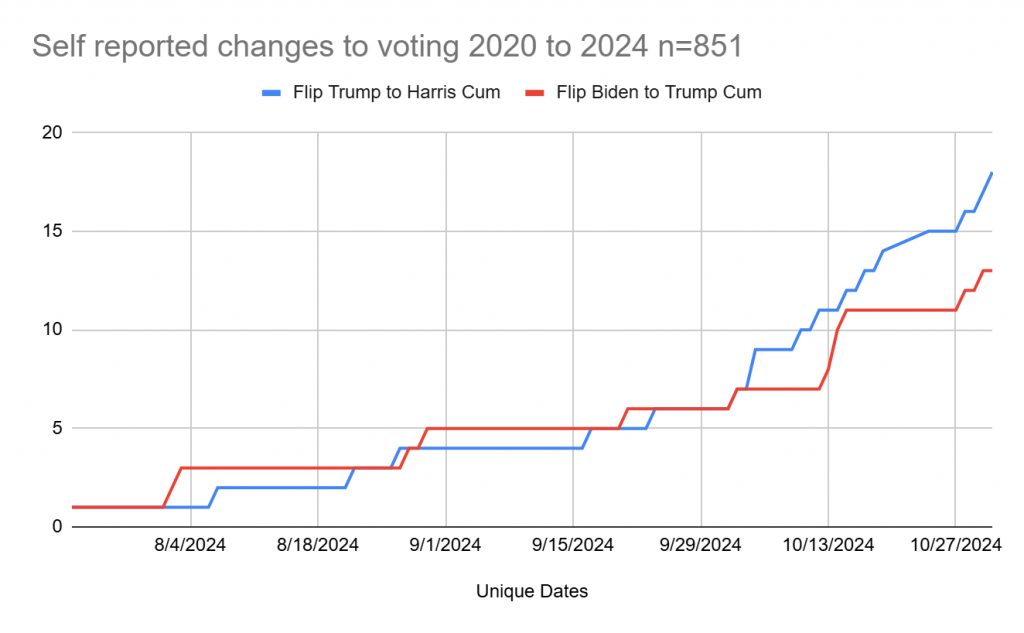
Among the 851 U.S.-based respondents, 31 individuals (3.6%) reported an intention to switch party allegiance in the 2024 election. Breaking down this small but notable subset, we found a greater inclination for Trump-to-Harris shifts (18 respondents) than for Biden-to-Trump (13 respondents). This aspect of party-switching can be influenced by evolving political climates and changing policy positions, highlighting the nuanced decisions that some voters are considering.
Party-switching trends reveal insights into voter dissatisfaction, policy disagreements, or ideological shifts, providing an additional layer of complexity to our analysis. Even within this modest percentage, the motivations behind switching allegiance hint at a fluctuating political landscape where voters’ values and priorities continue to evolve.
Projected Voter Turnout
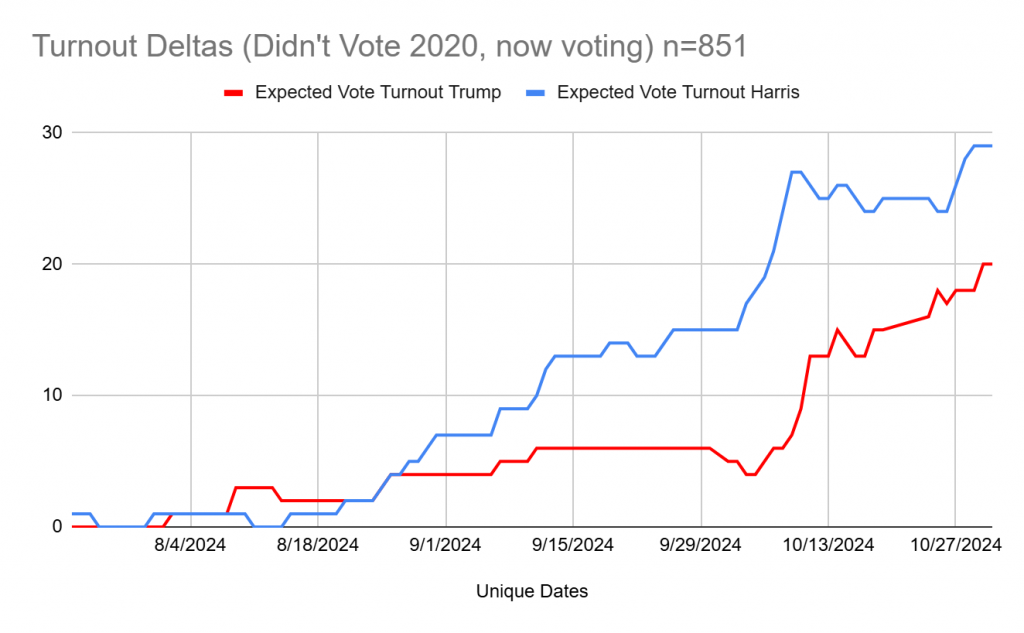
We also examined projected voter turnout by assigning a +1 score to those who plan to vote in 2024 but abstained in 2020, and a -1 score to those who voted in 2020 but do not plan to participate in 2024. This analysis showed anticipated net changes, with Harris seeing a +29 and Trump a +20. These turnout projections reveal voter enthusiasm, highlighting which candidates are gaining new supporters and which are losing momentum.
Turnout is crucial in predicting outcomes, as enthusiasm often drives final results. Voters disengaged in 2020 may now feel motivated, while some previous voters may sit out. Quantifying these shifts helps us better understand the 2024 turnout landscape.
Predicting the 2024 Presidential Election Outcome
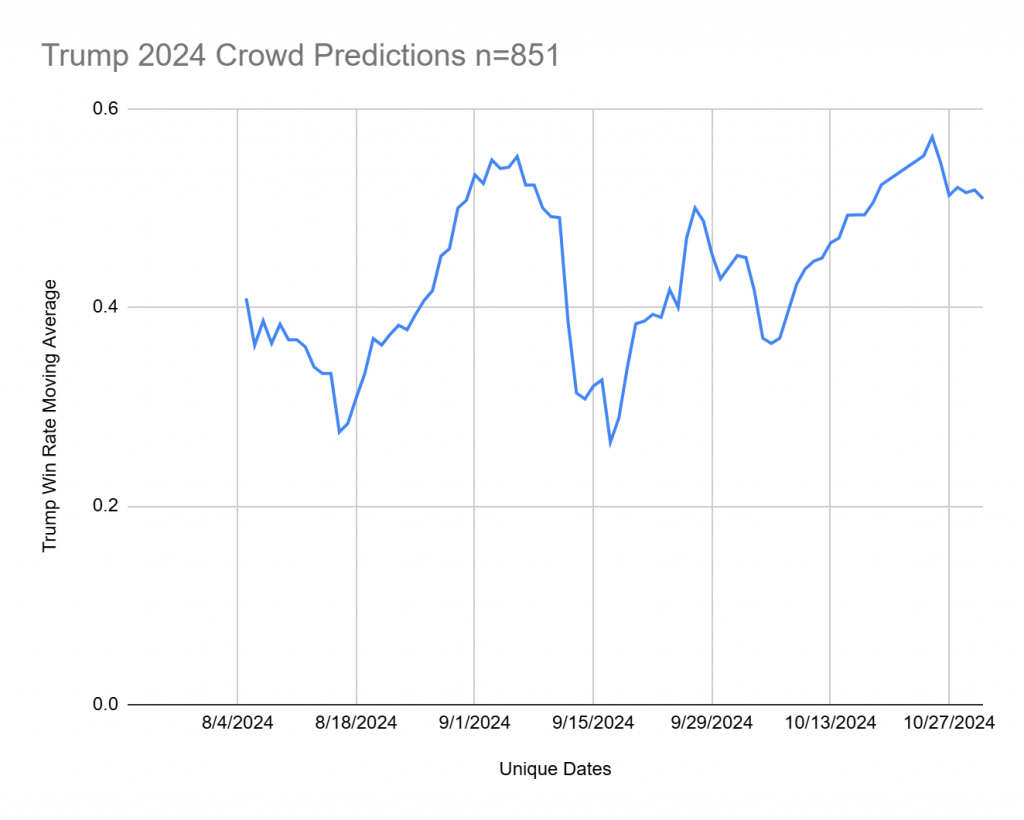
Finally, we asked participants to predict the election outcome. Using a 14-day moving average, we found the latest prediction showing 50.9% for Trump and 49.1% for Harris. This narrow margin shows the race’s competitiveness and emphasizes each voter’s role in shaping the results.
Predictions are never absolute, especially in a complex political landscape, but they offer a glimpse into current expectations. This prediction is based on respondents’ assessments, adding perspective to our findings and helping us gauge voter sentiment and anticipated choices as they consider their options.
Conclusion
While insightful, this study lacks the scientific rigor of formal polling; we did not stratify samples by geography, age, or gender.
Though the overall data lacks comprehensive accuracy for a definitive prediction, it suggests a slight advantage to Harris. However, the results nonetheless provide an intriguing snapshot of evolving voter attitudes as the election approaches. These findings reflect the dynamic nature of political opinion and the various factors that contribute to voters’ choices as they prepare for the 2024 presidential election.
Interested in Running Your Own Political Polls?
Check out our offerings at Polling.com for custom political polling solutions, where you can design tailored polls, analyze unique datasets, and gather insights relevant to your audience’s perspectives on issues that matter.
