What Statistical Parameters Are Used to Analyze Surveys?
The ability to collect and analyze survey data has become a cornerstone of informed decision-making in various fields, from business and marketing to healthcare and social research. Well-designed surveys provide valuable insights, but without proper analysis, raw data can be overwhelming and difficult to interpret. Understanding what statistical parameters are used to analyze surveys is crucial for transforming survey responses into actionable insights. By applying the right statistical methods, businesses and researchers can identify trends, measure public opinion, and make data-driven decisions with confidence.
Modern tools like Polling.com simplify survey analytics, making it easier for users to analyze data, generate reports, and visualize trends. This article explores key statistical parameters, essential analytical methods, and best practices for conducting effective survey research.
What Are Statistical Parameters in Survey Research?
Statistical parameters are fundamental in customer survey research, market research, academic studies, and various data-driven fields. These metrics help researchers:
- Identify trends and behavioral patterns.
- Compare responses across different demographics.
- Measure the reliability and accuracy of survey results.
- Interpret vast amounts of data through survey visual analysis techniques.
Survey analytics relies on these statistical methods to transform raw data into meaningful insights. For example, businesses use survey results to refine their products, while policymakers rely on survey data to shape public policies. Advanced analytical techniques also integrate user-friendly software tools, making analysis more efficient for all users.
Key Statistical Parameters to Analyze Surveys
1. Mean, Median, and Mode
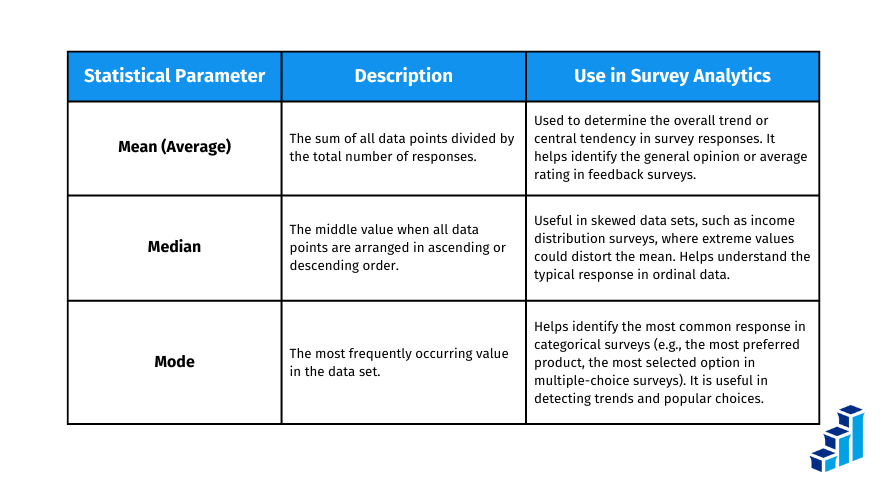
The first step in analyzing survey data is understanding measures of central tendency:
- Mean (average): The sum of all responses divided by the number of respondents.
- Median: The middle value when responses are arranged in ascending order.
- Mode: The most frequently occurring response in the dataset.
📌 Example:
Suppose a customer survey research study asks participants to rate a product on a scale of 1 to 5. If the average rating (mean) is 4.2 and the median is 4, it indicates generally positive feedback. However, if the mode is 5, it suggests most customers are highly satisfied.
These parameters help businesses summarize customer sentiments concisely.
2. Standard Deviation and Variance
Beyond central tendency, researchers must assess how responses vary across a dataset.
- Standard Deviation: Measures how much individual responses deviate from the mean.
- Variance: The square of standard deviation, representing data spread.
📌 Example:
A survey asks customers to rate a hotel’s service. Two scenarios arise:
- Low standard deviation: Responses are clustered around the mean (e.g., mostly 4s and 5s).
- High standard deviation: Responses vary widely (e.g., a mix of 1s, 3s, and 5s).
Understanding this variation helps businesses detect inconsistencies in customer experiences.
3. Cross-Tabulation for Data Comparison
Cross-tabulation (or contingency tables) helps researchers compare survey responses across different demographics or categories.
📌 Example:
A company conducting a customer survey research on product satisfaction can cross-tabulate data by age group. If younger consumers rate a product higher than older consumers, the business may tailor marketing efforts accordingly.
Survey visual analysis tools often display cross-tabulated data using bar charts or heatmaps for easier interpretation.
4. Confidence Intervals and Margins of Error
Surveys rarely capture responses from an entire population. Instead, they rely on sampling, introducing a margin of error.
- Confidence Interval (CI): Indicates the range within which the true population parameter likely falls.
- Margin of Error (MoE): Shows how much sample results may differ from the true population value.
📌 Example:
A survey reports that 60% of respondents prefer a brand, with a ±3% margin of error at a 95% confidence level. This means the true preference rate likely falls between 57% and 63%.
When designing analytical survey methods, businesses must ensure that confidence intervals are narrow enough for reliable conclusions.
5. Correlation and Regression Analysis
Understanding relationships between survey variables is key for predicting trends.
- Correlation Analysis: Measures how two variables are related (e.g., does higher customer satisfaction lead to increased brand loyalty?).
- Regression Analysis: Predicts outcomes based on survey data (e.g., does advertising spend affect customer retention rates?).
📌 Example:
A business analyzes whether higher engagement in a loyalty program correlates with higher purchase frequency. A strong correlation suggests the program effectively boosts sales.
Tools and Methods for Effective Survey Analysis
Selecting the right tools ensures accurate and efficient survey interpretation. What are good statistical tools for surveys? Here are some top choices:
Polling.com: The Best Survey Analytics Tool
Polling.com simplifies survey analysis with features like:
✔️ Real-time reports and dashboards.
✔️ Advanced survey visual analysis tools.
✔️ Easy integration with survey platforms.
Other Commonly Used Tools
- SPSS: Advanced statistical software for in-depth survey research.
- Excel: Useful for basic analysis with built-in statistical functions.
- R/Python: Ideal for handling large datasets and complex analytical models.
Choosing the right tool depends on the complexity of how to conduct a survey research project and the level of analysis required.
Best Practices for Conducting Survey Research
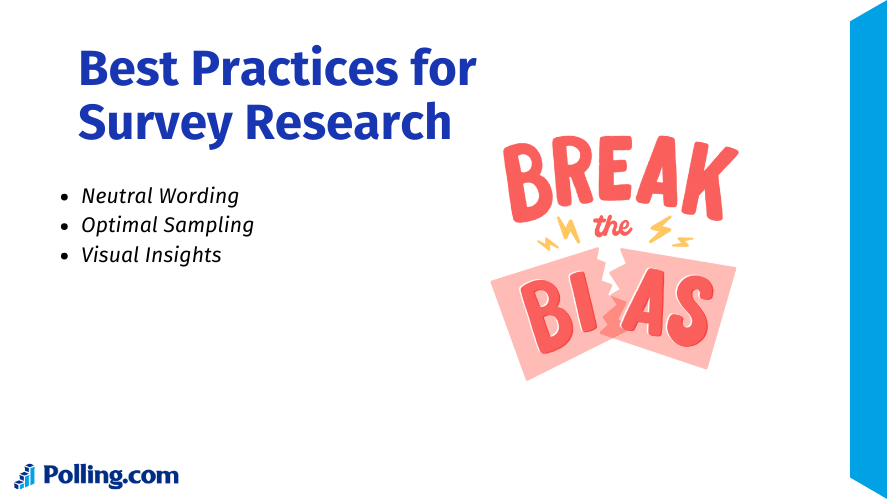
To ensure meaningful results, follow these best practices:
✔️ Write Clear and Unbiased Questions: Avoid leading questions that might influence responses.
✔️ Choose an Appropriate Sample Size: Too small a sample can distort findings, while too large a sample increases costs unnecessarily.
✔️ Use Survey Visual Analysis for Clarity: Data visualization enhances comprehension and presentation.
📌 Example:
A company studying customer satisfaction creates a survey report featuring charts that highlight trends over time. This makes data interpretation easier for stakeholders.
Common Pitfalls in Survey Analytics
🚨 Mistakes to Avoid:
❌ Ignoring response biases (e.g., social desirability bias).
❌ Overlooking key metrics like margins of error.
❌ Misinterpreting survey visual analysis results.
By avoiding these errors, businesses ensure accurate and actionable insights from their surveys.
Conclusion
Understanding what statistical parameters are used to analyze surveys is essential for extracting meaningful insights. From basic metrics like mean and standard deviation to advanced techniques like regression analysis, these tools enable researchers and businesses to make informed decisions.
Platforms like Polling.com make survey analytics easier, offering real-time reporting, customizable dashboards, and seamless data visualization. By leveraging these tools, businesses can optimize their customer survey research, leading to better strategies and improved decision-making.
Are you ready to take your survey research and data analytics to the next level? Start exploring Polling.com and unlock the power of data today!