What Is Customer Behavior Analysis?
Customer behavior analysis helps businesses discover how people interact with their products, services, and brand overall. This type of analysis is critical for answering key questions. For example, why do some customers leave without buying? What motivates others to come back again and again?
In today’s fast-moving digital world, understanding behavior is more important than ever. It helps companies make smart choices, improve customer experiences, and drive strong business growth.
To better understand your audience, you can simply ask them what they think. Tools like Polling.com make this process easier by helping you design fast and effective surveys. These tools allow businesses to collect real feedback and apply it immediately.
As you continue reading, you will learn what customer behavior analysis is, why it matters, and how you can use it to grow your company using simple tools and strategies.
What Is Customer Behavior Analysis?

Customer behavior analysis involves studying how people behave throughout the entire buying process. It shows you what they look at, how they decide, and whether they return.
If used correctly, this process can guide your marketing, improve your products, and strengthen your customer support. In turn, this leads to more loyal customers and higher revenue.
Key Components of Customer Behavior
There are several main parts of customer behavior that every business should examine. Together, they paint a full picture of how and why your customers act the way they do.
1. Purchasing Behavior
This area covers how people buy. Some shoppers do a lot of research, while others buy quickly. It is important to track these actions, as they reveal patterns that help you sell better.
Key things to monitor:
- How often they buy
- What they buy
- If they become repeat buyers
Knowing this makes it easier to shape marketing messages and offers.
2. Browsing and Engagement Behavior
Before buying, customers often explore websites, click on products, or read reviews. By watching these actions, you can understand what gets their attention.
For example:
- Which pages are most visited?
- How long do they stay?
- Do they click through to the checkout?
These behaviors show where your content is strong, and where it may need improvement.
3. Feedback and Satisfaction Metrics
While behavior tracking shows actions, surveys explain the reasons behind those actions. For this reason, survey questions for customers are essential.
They help answer questions like:
- Were they happy with the experience?
- What would make them come back?
- Would they recommend your product to others?
This type of input helps you understand the emotional side of customer behavior, which is often harder to track.
Data Sources for Behavior Analysis
If you want clear insights, you need to gather data from more than one source. Each one adds a new layer to your understanding of customer behavior.
1. Website Analytics
Tools such as Google Analytics are helpful because they show exactly how people interact with your site. You can learn:
- What pages are popular
- Where customers drop off
- Which features drive sales
When combined with other data, this helps you pinpoint what’s working and what needs to change.
2. CRM Data
Your Customer Relationship Management (CRM) system holds valuable records. It shows a customer’s full history, including purchases, messages, and service issues.
Using CRM data for customer behavior data analysis allows you to track trends over time and tailor your approach for each customer type.
3. Surveys and Polling Data (Powered by Polling.com)
Even with great tracking tools, only direct feedback tells you why customers behave a certain way. That is why surveys for customers are so powerful.
Polling.com lets you:
- Build surveys fast with drag-and-drop tools
- Send surveys through email, mobile, or your website
- Analyze responses instantly with visual dashboards
This helps you understand customer motivations and frustrations without delay.
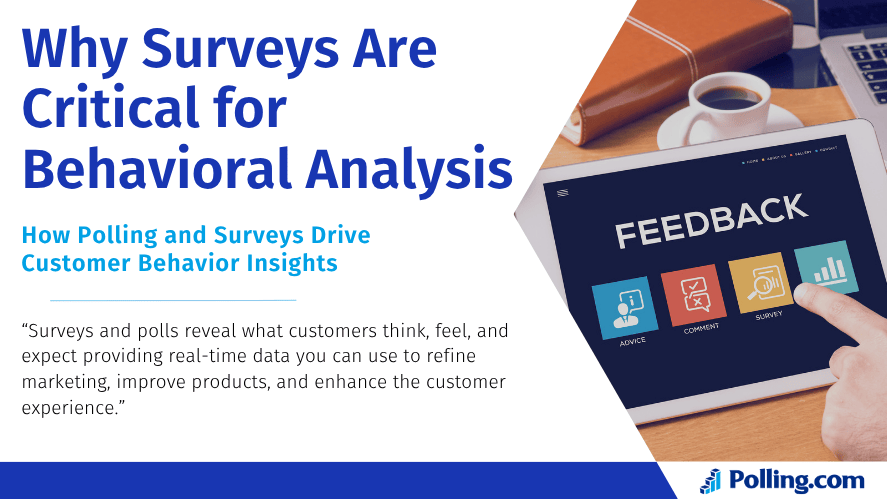
How Polling and Surveys Drive Customer Behavior Insights

Tracking behavior tells you what happened, but it does not explain why. Surveys fill that gap. When used regularly, they give you a clearer picture of what drives your customers.
1. Capturing Real-Time Feedback
After someone makes a purchase or browses your site, you can send a short survey. This gives you feedback while the experience is still fresh in their mind.
2. Understanding Motivations Behind Actions
If customers leave without buying, you may not know the reason. Even a basic survey can reveal issues related to cost, confidence, or available product choices.
3. Segmenting Audiences Based on Behavior
Once you collect survey results, you can divide your customers into smaller groups. For instance:
- People who care about price
- Loyal customers who value quality
- First-time visitors needing more information
These segments help you deliver more personal messages and improve conversions.
The Role of Polling.com in Customer Behavior Analysis
While many companies offer survey tools, few offer the smart features that Polling.com includes. It’s built for speed, simplicity, and powerful analysis.
1. Simple Survey Creation
No programming knowledge is required to begin. Instead, you can:
- Use ready-made templates
- Select from suggested survey questions
- Customize surveys for specific goals
This helps you launch campaigns faster.
2. Live Data and Visual Reports
Polling.com shows you answers as they arrive. This means you can:
- Track customer satisfaction in real time
- Spot trends quickly
- Make data-backed decisions
Rather than waiting days for reports, you act as soon as insights appear.
3. Competitive Advantage
Compared to tools like Google Forms, Typeform, or SurveyMonkey, Polling.com offers more business-focused features. These include:
- Smart branching logic
- AI-driven recommendations
- Easy integration with your CRM
It is one of the top customer feedback tools on the market, especially for behavior analysis.
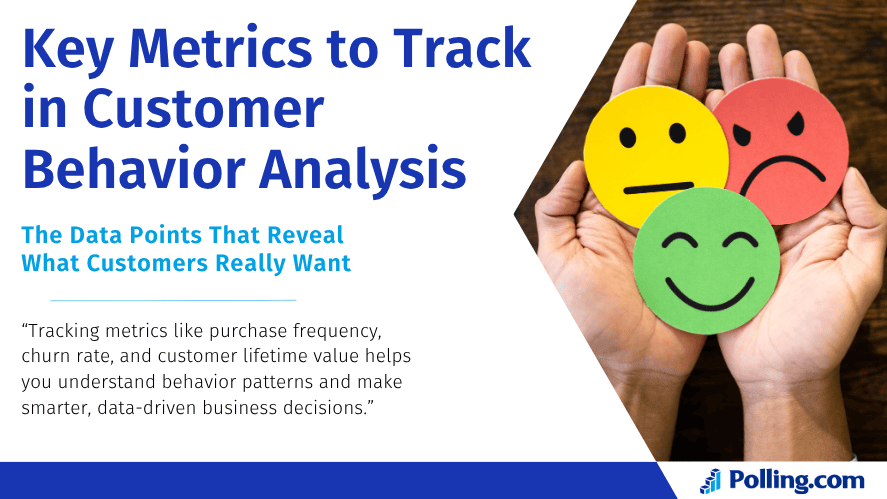
Key Metrics to Track in Customer Behavior Analysis

When doing customer behavior analysis, you need to track a few core metrics. These numbers offer insights into how customers feel and behave.
Net Promoter Score (NPS)
NPS measures customer loyalty. You ask one simple question: “How likely are you to recommend our brand to a friend?”
Then, group the results:
- Promoters (9–10): Love your brand
- Passives (7–8): Neutral
- Detractors (0–6): Unhappy
Polling.com lets you send this survey automatically. You can track scores over time and see if your service changes are working.
Customer Satisfaction Score (CSAT) and Customer Effort Score (CES)
This measures how satisfied customers are after a specific event. You can ask: “How satisfied were you with your delivery?”
This tells you how easy it was for customers to complete a task. You might ask: “It was easy to solve my problem today.” They then choose how much they agree.
With Polling.com, these surveys are easy to build, track, and analyze, helping you improve the customer journey.
How to Perform Customer Behavior Analysis with Polling.com

You don’t need to be a data expert to begin. Here’s a quick guide that anyone can follow.
Step-by-Step Walkthrough
- Set Clear Goals
Start by asking yourself what you want to learn. Do you want more repeat purchases? Are you trying to fix a checkout issue?
- Build Your Survey
Use Polling.com to select a template or create your own. Make sure your questions to ask for surveys match your goal.
- Segment Your Audience
You can send different surveys to:
- New customers
- Returning users
- High-spending shoppers
This lets you gather targeted insights.
- Review the Results
Polling.com makes this easy. You can:
- Sort answers by segment
- Track key trends
- Identify issues fast
- Act on the Feedback
Use the data to fix problems or improve experiences. Then, send another survey later to see if things improved.
Case Study Example: A Business Using Polling.com
Company: Bright Wear Apparel
Problem: High product return rate
Solution: Sent surveys to customers who returned items
Questions Included:
- “Why did you return your product?”
- “What could have improved your shopping experience?”
Findings:
Many returns were due to unclear sizing. After improving size guides and adding more photos, return rates dropped by 20%.
This customer behavior analysis example shows how surveys lead to real, fast results.
Best Practices for Accurate and Actionable Insights

Good insights start with good practices. Use these tips to get the most from your surveys.
1. Use Both Numbers and Comments
Mix simple rating questions with open-ended ones. The ratings give you trends, while the comments explain them.
2. Keep Questions Neutral
Avoid questions that lead the customer to a certain answer. For example:
- Good: “What was your overall experience?”
- Bad: “Wasn’t our service excellent?”
Keeping it neutral gets honest answers.
3. Refresh Your Surveys Often
As your business evolves, so should your surveys. Review them at least once per quarter. This is part of the best practices for customer satisfaction surveys.
Conclusion: Turning Customer Behavior Insights into Business Growth
Customer behavior analysis is more than a buzzword. It’s a key to smarter decisions, better service, and lasting relationships.
By using tools like Polling.com, you make it easier to understand and respond to your customers. From simple feedback to detailed customer behavior data analysis, Polling.com helps turn answers into action.
With the right surveys, smart questions, and regular analysis, your business will grow more efficiently. Not only will you gain new customers, but you’ll also keep the ones you already have.
Try Polling.com today to start gathering real feedback. It’s fast, easy, and built for growing businesses.
