What Are the Different Types of Scales Used for Surveys
Survey scales play a critical role in collecting accurate and actionable data.
Instead of just gathering opinions, they help turn responses into measurable insights that can be analyzed and compared.
Choosing the right survey scale directly impacts how clearly respondents can express their thoughts. It also impacts how useful the data will be for decision-making.
When the right scale is used, responses become more consistent, easier to interpret, and more reliable for analysis.
Modern tools like Polling.com simplify this process by offering ready-to-use survey scale examples, intuitive design options, and built-in analytics with practical survey scales examples.
To better understand how to use them effectively, let’s explore the different types of scales used for surveys and when to apply each one.
What Are Survey Scales and Why Do They Matter
Survey scales are structured response formats used in survey questions to measure opinions, attitudes, behaviors, or preferences.
Instead of open-ended answers, scales provide a defined set of options that make responses easier to quantify.
The main role of survey scales is to convert subjective input into data that can be analyzed.
For example, a survey with rating scale (like 1–5) allows businesses to measure satisfaction levels, while a Likert scale survey captures degrees of agreement or disagreement.
Using the right scale improves data consistency and analysis within your methodology and survey method.
When all respondents answer within the same structure, it becomes easier to compare results, identify trends, and draw meaningful conclusions.
This is especially important in large-scale surveys or ongoing tracking studies.
However, there are common mistakes when selecting scales.
These include using scales that are too complex, mixing different scale types within the same survey, or failing to clearly label response options.
Such issues can confuse respondents and reduce the quality of your data.
Different Types of Scales Used for Surveys
Choosing the right survey scale depends on what kind of data you want to collect and how deeply you want to analyze it.
Below are the most common types of survey scales.
Nominal Scale

The nominal scale is the simplest type. It groups responses into categories without any order.
For example, if you ask respondents to select their gender, location, or preferred product type, you’re using a nominal scale.
This scale is best when you just need to classify data rather than compare it.
However, since there’s no ranking or measurable difference between options, it doesn’t provide deeper analytical insights.
Ordinal Scale

Unlike nominal scales, the ordinal scale introduces order.
It allows respondents to rank their answers, such as rating their satisfaction as happy, neutral, or unhappy.
This makes it useful for customer feedback surveys, where understanding relative sentiment is important.
That said, the gap between each option isn’t clearly defined, so while you know the order, you can’t measure the exact difference between responses.
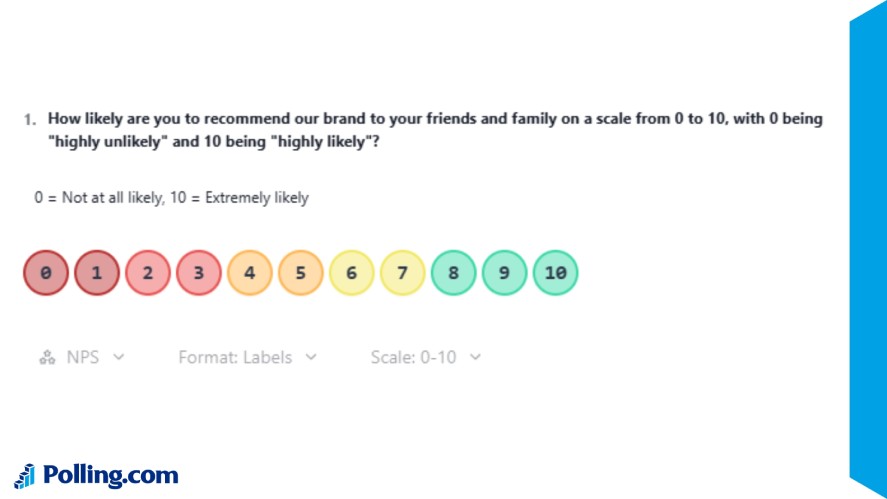
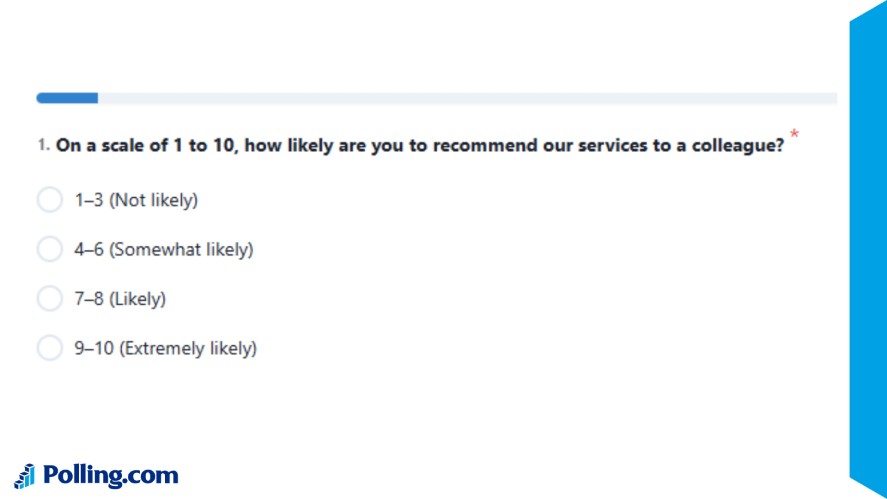
Interval Scale
The interval scale takes things a step further by offering ordered responses with equal spacing between them.
A common example is a 1–10 rating scale used in many survey and results analyses.
This type of scale is valuable because it allows you to calculate averages and compare differences more accurately.
However, it lacks a true zero point, which means certain calculations (like ratios) are not possible.
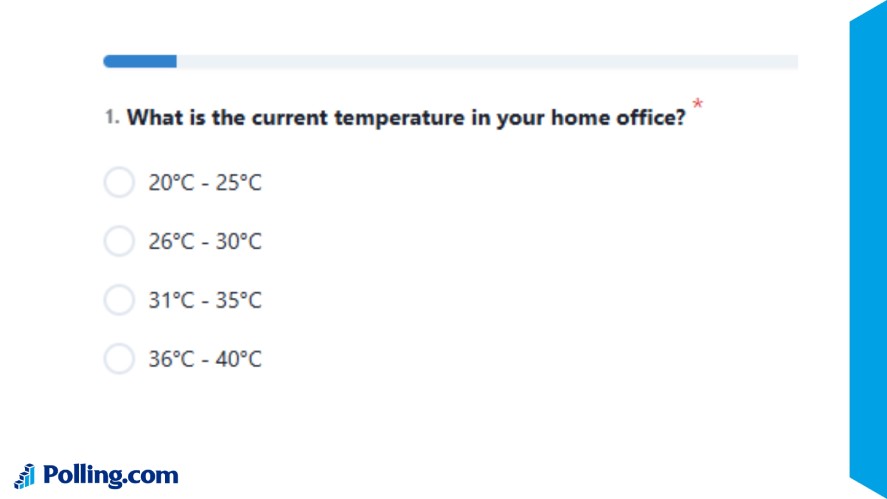
Ratio Scale

The ratio scale is the most advanced and data-rich option. It includes everything an interval scale offers, plus a true zero point.
For example, questions about age, income, or number of purchases fall into this category.
Because of the true zero, you can perform a full statistical analysis, making it ideal for surveys that require precise and measurable data.
Likert Scale
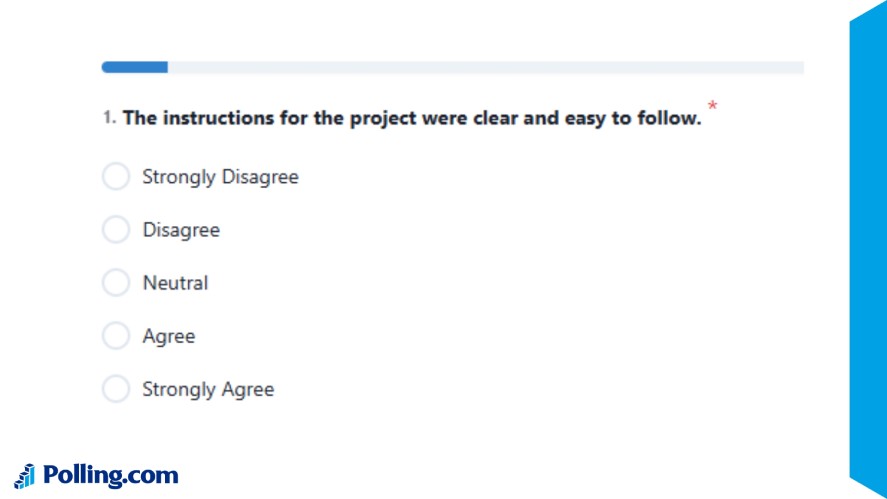
The Likert scale survey is one of the most widely used formats for measuring opinions and attitudes.
It typically ranges from “strongly agree” to “strongly disagree”.
This scale works well because it captures the intensity of a respondent’s feelings, not just the direction. It’s especially useful in engagement, satisfaction, and feedback surveys.
To get the best results, keep statements clear, balanced, and consistent across questions.
Semantic Differential Scale

The semantic differential scale measures perception by asking respondents to rate something between two opposite adjectives.
For example, a rate between “easy vs difficult” or “fast vs slow”.
This makes it particularly useful for brand perception and user experience surveys, where understanding how people feel about a product or service is just as important as what they think.
Rating Scale
A rating scale is one of the most familiar formats, allowing users to evaluate something using numbers, stars, or even sliders.
Examples include 1–5 star ratings or a slider scale survey from 0 to 10 as a sliding scale survey question.
Because it’s simple and intuitive, it’s commonly used in product reviews and customer satisfaction surveys.
It also provides structured data that’s easy to analyze and compare.
Binary Scale
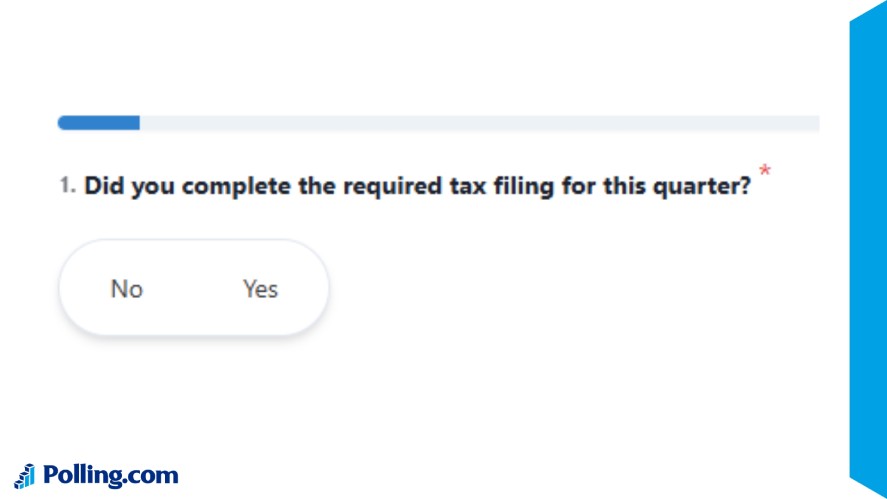
Finally, the binary scale offers only two choices, such as yes/no or true/false. This makes it quick and easy for respondents to answer.
While it’s useful for simple decisions or screening questions, it lacks depth.
You won’t get detailed insights into why someone chose a particular answer, which limits its usefulness in more complex surveys.
How to Choose the Right Survey Scale
Selecting the right survey scale is essential for collecting accurate and meaningful data and creating the best survey questions.
The choice you make should always align with your research goals and the type of insights you want to generate.
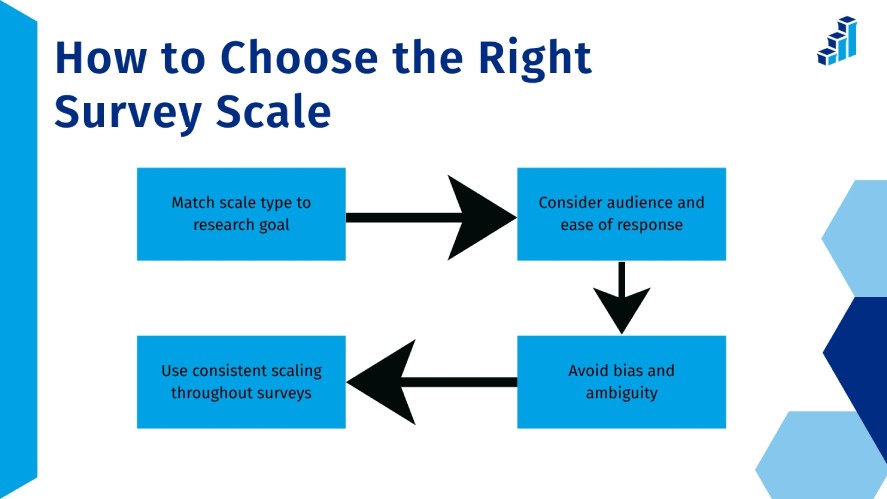
First, match the scale type to your research objective. If you only need to categorize responses, a nominal scale is enough.
If you want to measure opinions or satisfaction levels, ordinal or Likert scale survey formats work better.
For more advanced analysis, interval or ratio scales provide deeper insights.
Next, consider your audience and ease of response.
The scale should feel intuitive and quick to answer.
If respondents have to think too hard about what each option means, it can lead to inconsistent or inaccurate answers.
Simpler formats like rating scales or sliders often perform better for general audiences.
In addition, make sure to avoid bias and ambiguity.
Poorly worded scales, such as unbalanced options or unclear labels, can influence responses and skew your data.
Each option should be neutral, clearly defined, and evenly distributed.
Finally, use consistent scaling throughout your survey.
Switching between different types of scales used for surveys or formats can confuse respondents and make your data harder to analyze.
Keeping a consistent structure improves the user experience and the reliability of your results.
Best Practices for Using Survey Scales
Even after choosing the right scale, how you implement it can significantly impact your results and support good survey questions.
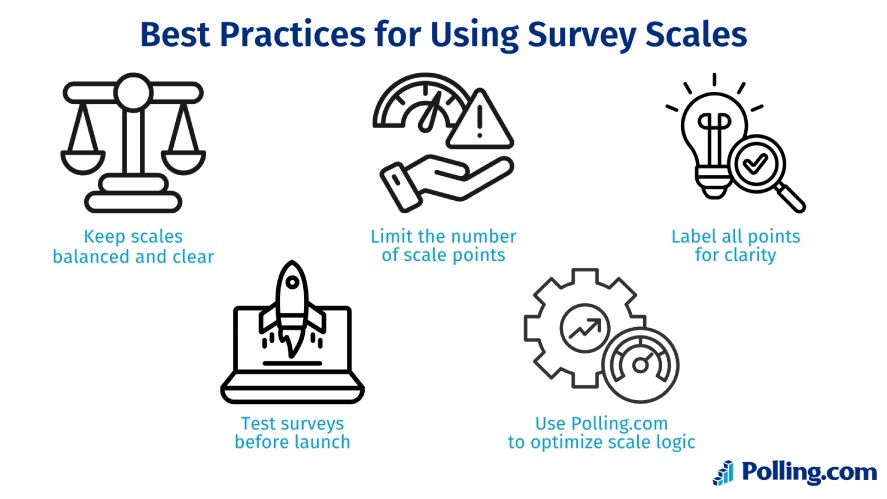
Start by keeping scales balanced and easy to understand.
For example, if you’re using a satisfaction scale, include an equal number of positive and negative options with a neutral midpoint when appropriate.
This helps avoid bias and gives respondents a fair range of choices.
Also, limit the number of scale points.
While it may be tempting to add more options for precision, too many choices can overwhelm respondents.
In most cases, 5–7 points provide the right balance between detail and simplicity.
Another important step is to label all scale points clearly.
Instead of only labeling the endpoints, adding labels to each option reduces confusion and ensures respondents interpret the scale consistently.
Lastly, before launching your survey, test it thoroughly.
Running a quick test helps identify unclear questions, confusing scales, or usability issues, especially on mobile devices.
To streamline the process, tools like Polling.com can help optimize your scale design and analysis.
Key advantages include:
- Pre-built scale templates for faster setup
- Advanced analytics for scale-based responses
- Real-time insights to quickly interpret survey results
By combining the right scale selection with strong implementation practices, you can significantly improve data quality and make better, data-driven decisions.
Common Mistakes to Avoid When Using Different Types of Scales Used For Surveys
Even with the right survey scale, poor implementation can reduce data quality and make results harder to interpret.
Avoiding these common mistakes will help ensure your survey delivers reliable insights.
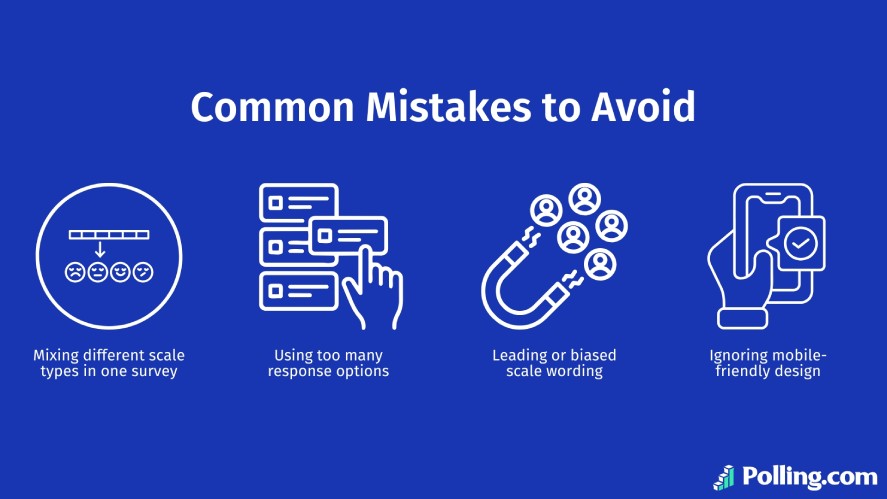
One common issue is mixing different types of scales used for surveys.
Switching between formats can confuse respondents and lead to inconsistent answers. So, keeping scales consistent improves both user experience and data accuracy.
Another mistake is using too many response options.
While more choices may seem like they provide better precision, they often overwhelm respondents and slow down completion.
In most cases, a simpler scale leads to clearer and more reliable responses.
It’s also important to avoid leading or biased scale wording.
If the scale is unbalanced or suggests a preferred answer, it can influence how people respond. Neutral, clearly defined options are key to collecting honest feedback.
Finally, ignoring mobile-friendly design can significantly impact response rates.
Many users complete surveys on their phones, so scales should be easy to read, tap, or slide without friction.
How Polling.com Enhances Survey Scaling
Using the right platform can make a major difference in how effectively you design and analyze survey scales.
Polling.com is built to simplify both the creation and optimization of scale-based surveys.
Key advantages include:
- Easy-to-use scale templates that speed up survey creation
- Advanced analytics for deeper insights into survey and results
- A cleaner, more intuitive UX compared to many traditional tools
- Real-time insights and reporting to track responses as they come in
These features help businesses move from raw responses to actionable insights faster, without the complexity often found in other survey tools.
Conclusion
Choosing the right different types of scales used for surveys is essential for collecting accurate, consistent, and meaningful data.
From simple categories to advanced rating systems, each scale plays a role in how effectively you capture and analyze responses.
When applied correctly, proper scaling improves response quality, simplifies analysis, and leads to better decision-making.
On the other hand, poor scale choices can introduce bias, confusion, and unreliable results.
To get the most out of your surveys, using a platform like Polling.com can make the survey process easier and more efficient.
With intuitive tools and built-in analytics, you can create optimized surveys, analyze results in real time, and turn feedback into actionable insights.