Introduction to Statistical Software for Survey Data Analysis in 2024
Have you ever wondered how organizations make sense of the vast amounts of survey data they collect? The answer lies in the use of sophisticated statistical software.
In 2024, the landscape of survey data analysis is more advanced and efficient than ever before, thanks to the continuous evolution of statistical software.
What is Statistical Software?
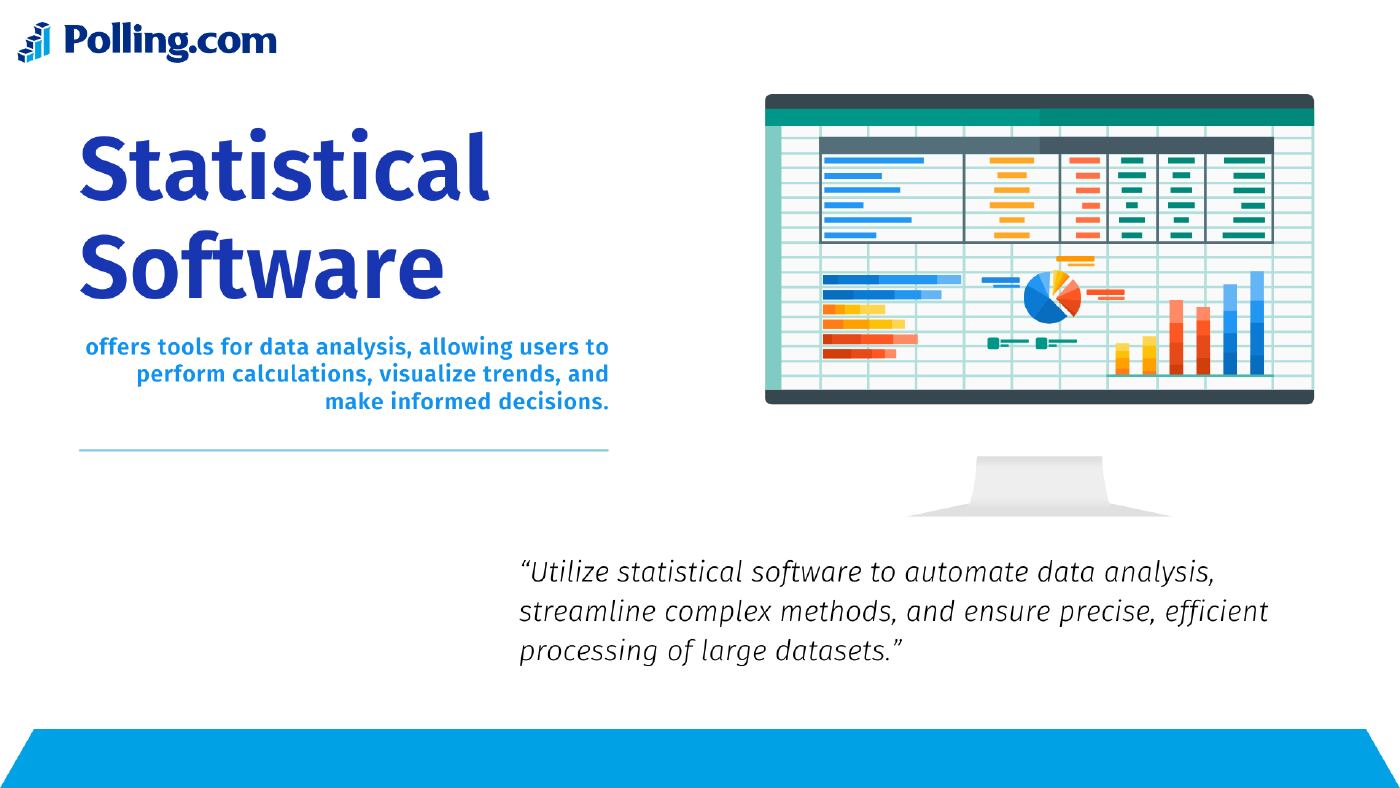
Statistical software refers to specialized computer programs designed to assist in the collection, analysis, interpretation, and presentation of quantitative data. These tools play a crucial role in survey data analysis by providing accurate and efficient ways to process complex datasets.
The importance of using specialized software cannot be overstated; it ensures that data analysis is not only precise but also time-efficient, allowing researchers to focus on deriving meaningful insights rather than getting bogged down by data processing tasks.
The advancements in statistical software in 2024 are particularly noteworthy. With the integration of artificial intelligence (AI) and machine learning (ML), these tools have become smarter, offering predictive analytics and more intuitive interfaces.
Additionally, the trend towards cloud-based solutions is making data analysis more accessible and collaborative than ever before.
Importance of Statistical Software in Survey Data Analysis
Accuracy and Efficiency
Statistical software significantly enhances the accuracy of data analysis. These tools are designed to handle large datasets with precision, reducing the risk of human error. For example, software like SPSS and SAS come with built-in algorithms that ensure data integrity and consistency, making it easier to draw accurate conclusions from survey data.
Efficiency is another major benefit. Conventional data analysis techniques often require substantial time and effort. However, statistical software automates many of these tasks, from data cleaning to complex calculations, saving valuable time. This efficiency allows researchers to analyze large datasets quickly and make informed decisions faster.
Handling Complex Data
Survey data often involves complex structures, including multiple variables, nested data, and missing values. Modern statistical software is equipped to manage these complexities effectively. For instance, R and RStudio offer advanced packages like survey and dplyr that simplify the analysis of complex survey data.
Features such as multivariate analysis, regression models, and data visualization tools help in understanding intricate data patterns. These capabilities enable researchers to handle complex data structures and extract meaningful insights that might be missed with simpler tools.
Key Features of Modern Statistical Software
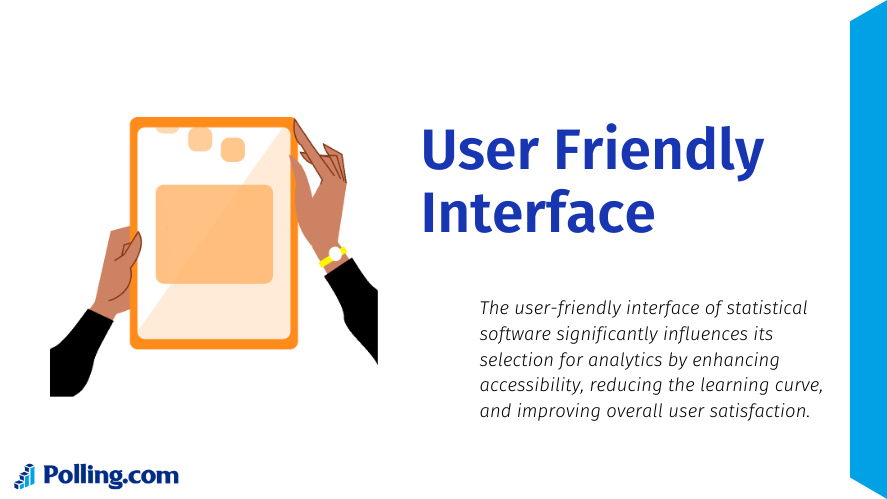
User-Friendly Interfaces
One of the critical advancements in modern statistical software is the development of user-friendly interfaces. These interfaces are designed to be intuitive, allowing non-technical users to navigate and use the software effectively. For example, tools like Tableau offer drag-and-drop functionality, making data visualization accessible to users without a background in statistics.
Advanced Analytical Tools
Modern statistical software comes with a suite of advanced analytical tools. These include regression analysis, multivariate analysis, and machine learning algorithms. For instance, Python’s libraries such as Pandas and SciPy provide robust tools for performing complex statistical analyses and visualizations, enabling users to derive deeper insights from their survey data.
Integration and Compatibility
Integration with other tools and data sources is a vital feature of modern statistical software. Seamless compatibility allows researchers to import and export data easily, facilitating a smooth workflow. Software like SAS and SPSS are known for their excellent integration capabilities with various data formats and external databases, enhancing their utility in survey data analysis.
Automation and Customization
Automation in statistical software helps streamline repetitive tasks such as data cleaning, transformation, and reporting. Customization options allow users to tailor the software to their specific needs. For example, R allows users to write custom scripts and functions, enabling highly personalized data analysis workflows.
Popular Statistical Software in 2024
SPSS
SPSS (Statistical Package for the Social Sciences) is a widely used software for survey data analysis. It offers a comprehensive suite of tools for statistical analysis, data management, and data documentation. SPSS is particularly favored for its user-friendly interface and robust analytical capabilities, making it a popular choice among researchers in social sciences.
SAS
SAS (Statistical Analysis System) is another leading software for data analysis. Known for its powerful analytics, SAS is used extensively in various industries, including healthcare, finance, and market research. It provides advanced tools for predictive modeling, data mining, and machine learning, making it a versatile tool for survey data analysis.
R and RStudio
R is a free, open-source software environment for statistical computing and graphics, while RStudio provides an integrated development environment (IDE) for R. Together, they offer powerful tools for survey data analysis, including a wide range of packages specifically designed for handling survey data. The flexibility and extensibility of R make it a favorite among statisticians and data scientists.
Stata
Stata is a powerful statistical software package used for data analysis, data management, and graphics. It is known for its user-friendly interface and comprehensive suite of statistical tools. Stata is particularly strong in handling panel data and complex survey data, making it a valuable tool for researchers.
Python (with Pandas and SciPy)
Python, with its extensive libraries such as Pandas and SciPy, is becoming increasingly popular for survey data analysis. These libraries offer powerful tools for data manipulation, statistical analysis, and visualization. Python’s versatility and ease of integration with other data sources make it an attractive choice for researchers looking to perform advanced data analysis.
Software Comparisons
SPSS vs. SAS
User Interface: SPSS is often praised for its user-friendly, point-and-click interface, which is especially suitable for users without a programming background. SAS, on the other hand, has a more complex interface that requires programming skills, making it more suitable for advanced users.
Analytical Capabilities: Both SPSS and SAS offer powerful analytical capabilities, but SAS is known for its superior data management and advanced analytics features. SPSS is excellent for basic to intermediate statistical analysis, while SAS excels in complex and large-scale data analyses.
Cost: SPSS tends to be more affordable, particularly for academic users, whereas SAS can be more expensive, reflecting its extensive capabilities and enterprise-level features.
R and RStudio vs. Python (with Pandas and SciPy)
Flexibility and Customization: Both R and Python are highly flexible and customizable. R is specifically designed for statistical analysis and visualization, with a vast library of packages like ggplot2 and shiny that cater to various statistical needs. Python, while a general-purpose programming language, has powerful libraries like Pandas for data manipulation and SciPy for statistical analysis.
Ease of Learning: Python is generally considered easier to learn due to its simpler syntax and readability, making it a good starting point for beginners. R, while very powerful, has a steeper learning curve, particularly for those without a statistical background.
Community and Support: Both languages have large, active communities that contribute to a wealth of resources and support. R’s community is more focused on statistical analysis, while Python’s community spans a broader range of applications, including web development, machine learning, and more.
Stata vs. SPSS
User Interface: Both Stata and SPSS have user-friendly interfaces, but SPSS’s point-and-click interface is often considered more intuitive for beginners. Stata’s command-driven interface, while user-friendly, requires some learning to use effectively.
Statistical Capabilities: Stata is known for its strong capabilities in handling complex survey data and panel data. It offers advanced statistical procedures that are particularly useful for econometrics and biostatistics. SPSS, while also powerful, is more commonly used for social sciences and market research.
Cost: Stata and SPSS both offer academic discounts, but the pricing can vary depending on the package and license type. Generally, SPSS might be more cost-effective for academic institutions, whereas Stata provides comprehensive features at a competitive price for professional use.
Case Studies and User Feedback
Real-World Applications

Healthcare
- SPSS and SAS: These tools are extensively used in healthcare research due to their robust statistical analysis capabilities and comprehensive data management features. They are essential for:
- Clinical trials
- Epidemiological studies
- Health services research
Economics
- Stata: This software is favored by economists for its strong statistical and econometric analysis tools. It plays a crucial role in:
- Academic research
- Policy analysis
- Financial modeling
Data Science
- Python: Known for its extensive libraries, Python is a go-to language for data scientists, utilized by major companies such as Google, Netflix, and Spotify for:
- Machine learning
- Data wrangling
- Predictive analytics
- Data-driven decision-making processes
Education
- R: R is widely used in academia for teaching statistics and data analysis. Its open-source nature and flexibility make it a preferred tool for:
- Educational purposes
- Academic research
User Reviews
- R: Users appreciate its comprehensive statistical capabilities and the vast array of packages available. However, some find the learning curve steep.
- Python: Praised for its readability and versatility, Python is favored by those who appreciate its wide range of applications beyond statistics.
- SPSS: Valued for its user-friendly interface, SPSS is often the go-to choice for non-programmers in social sciences. However, its cost can be a drawback.
- SAS: Known for its reliability and support, SAS is favored by large enterprises. The complexity and cost can be challenging for smaller organizations.
- Stata: Users like its combination of command-line and GUI options, making it accessible yet powerful. It is especially popular in research settings.
- Excel: While not as powerful as specialized software, Excel’s ease of use and familiarity make it a common tool for basic analysis. Its limitations in handling large datasets and complex analyses are noted by users.
Recommendations
When choosing and implementing statistical software, it is essential to consider factors such as ease of use, compatibility with existing systems, and the availability of support and resources. It is also important to stay updated with the latest software features and trends to ensure that the chosen tool remains effective and efficient.
Common challenges in survey data analysis include handling missing data, dealing with complex survey structures, and ensuring data security. Utilizing software with robust data handling capabilities and strong security features can help overcome these challenges.
Future Trends in Statistical Software for Survey Data Analysis
AI and Machine Learning Integration
The integration of AI and ML into statistical software is revolutionizing survey data analysis. These technologies enable predictive analytics, automated data cleaning, and advanced pattern recognition, making data analysis more efficient and insightful. For example, AI-powered tools can automatically identify trends and anomalies in survey data, providing deeper insights than traditional methods.
Cloud-Based Solutions
The shift towards cloud-based statistical software is a significant trend in 2024. Cloud-based solutions offer numerous benefits, including scalability, accessibility, and collaborative features. Researchers can access and analyze data from anywhere, share insights in real-time, and collaborate more effectively. However, it is important to consider data security and privacy when using cloud-based tools.
Enhanced Data Security
With the increasing emphasis on data privacy and security, modern statistical software is incorporating advanced security features. These include data encryption, secure data storage, and compliance with data protection regulations. Ensuring data security is crucial, especially when dealing with sensitive survey data.
Conclusion
Summary of Key Points
In conclusion, statistical software plays a pivotal role in survey data analysis by enhancing accuracy, efficiency, and the ability to handle complex data. The advancements in 2024, including AI integration and cloud-based solutions, are making these tools more powerful and accessible than ever before. Popular software like SPSS, SAS, R, Stata, and Python offer a range of features tailored to different needs, providing researchers with the tools necessary to derive meaningful insights from survey data.
Final Thoughts
Staying updated with the latest trends and best practices in statistical software is essential for effective survey data analysis. By leveraging the capabilities of modern statistical tools, researchers can ensure that their data analysis is accurate, efficient, and insightful, ultimately leading to better decision-making and improved outcomes.
For those interested in exploring further, numerous resources are available online to help you stay abreast of the latest developments in statistical software and survey data analysis techniques. Embrace these tools and trends to unlock the full potential of your survey data.