Churn Risk: What to Ask in an NPS Survey to Identify It
For any subscription-based or SaaS business, churn risk (or the likelihood of customers leaving or cancelling) is one of the most critical metrics to watch.
Even a small increase in churn can have a major impact on recurring revenue, customer lifetime value, and long-term growth, making churn risk prediction critical for subscription-based businesses.
That’s where the Net Promoter Score comes in.
Traditionally used to measure customer loyalty, NPS can also be a powerful diagnostic tool for spotting early signs of churn risk.
By going beyond the standard “Would you recommend us?” question and asking targeted follow-ups, you can uncover why some users may be dissatisfied or at risk of leaving.
In this article, we’ll explore how to use NPS strategically to identify and prevent churn risk early. You’ll also find practical question templates and survey flow tips to turn customer feedback into actionable retention insights.
Understanding Churn Risk Definition and NPS
Churn risk meaning refers to the probability that a customer will stop using your product or service.
It’s a key performance indicator in retention-driven models like SaaS, streaming, or subscription businesses, where keeping existing customers is often more cost-effective than acquiring new ones.
High churn usually signals deeper issues with product value, support quality, or user experience.
How NPS Links to Churn Risk
Your NPS survey responses can reveal more than just overall satisfaction.
Customers who score between 0–6 (Detractors) are often at the highest risk of churn, as they’re unhappy and may already be looking for alternatives.
Passives (7–8) appear content but are vulnerable to switching if a competitor offers something slightly better.
Meanwhile, Promoters (9–10) are loyal advocates who help stabilize retention and growth.
Why The Core NPS Question Isn’t Enough
While “How likely are you to recommend us?” is one of the standard Net Promoter Score questions, it doesn’t explain why a customer feels that way.
To truly assess churn risk, you need follow-up questions that dig into specific issues, such as feature gaps, pricing concerns, or support experiences, that may be driving dissatisfaction.
These insights help you take timely action before customers decide to leave.
Core NPS Question and Branching Strategy
At the heart of every NPS survey lies a single, powerful NPS score question:
“How likely are you to recommend our product or service to a friend or colleague?”
Respondents rate their likelihood on a 0–10 scale, and based on their answers, they fall into three groups:
- Promoters (9–10): Enthusiastic supporters who love your product and are likely to recommend it. They’re your brand advocates and tend to have low churn risk.
- Passives (7–8): Satisfied but uncommitted users. They may not complain, but they’re vulnerable to churn if a competitor offers better value or features.
- Detractors (0–6): Unhappy customers who are most at risk of leaving, and potentially damaging your reputation through negative word of mouth.
However, to truly leverage NPS for churn prediction, you need to go beyond this single question. This is where branching logic comes in.
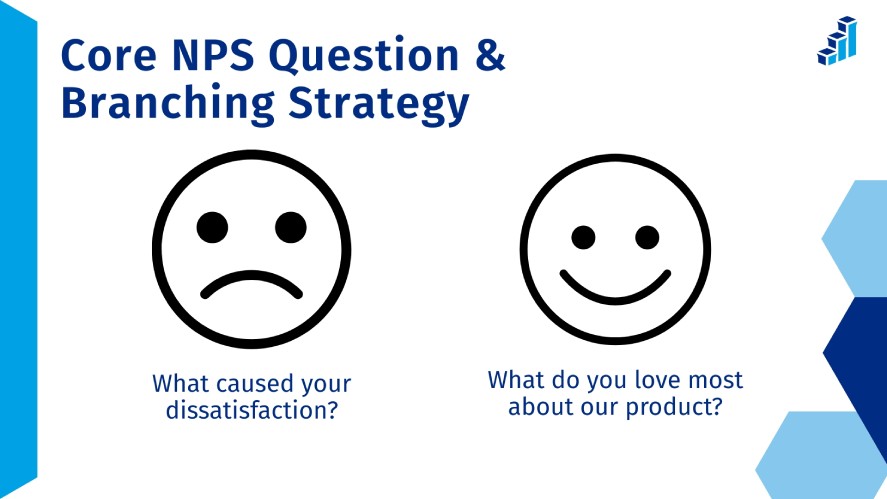
With branching and a clear NPS question format, your survey automatically tailors follow-up questions based on each respondent’s score, especially when using a structured platform like the Polling.com NPS survey tool to streamline survey creation and branching logic.
For example, detractors might be asked what caused their dissatisfaction, while promoters might be asked what they love most about your product.
This approach turns a simple loyalty measure into a churn risk detection system, helping you uncover the why behind customer sentiment and act before it’s too late.
Key Follow‑Up Questions to Ask to Identify Churn Risk
These NPS question examples and follow-up questions are what transform a standard NPS survey into a powerful churn risk assessment tool.
By tailoring your questions to each customer segment, you can uncover the real reasons behind satisfaction or dissatisfaction.
For Detractors (0–6): Highest Churn Risk
Detractors represent your most dissatisfied users. Their feedback reveals critical friction points that could be driving cancellations or poor experiences.
Ask questions like:
- What is the main reason for your score?
- Were there any moments when you considered cancelling or switching providers? If so, why?
- Which features or parts of our product/service failed to meet your needs?
- Did you encounter any technical issues, friction, or support gaps that influenced your decision?
- What could we have done differently to retain you?
For Passives (7–8): Vulnerable Churn Risk
Passives may seem content, but they’re the silent flight risk. They could churn quietly if competitors tempt them.
Ask questions like:
- What would have made you give us a higher score?
- Are there specific features, services, or competitors you are considering?
- Where did we fall short in meeting your expectations?
For Promoters (9–10): Loyal but Still Insightful
Promoters are less likely to churn, but their feedback helps you understand what drives loyalty and where you can deliver even more value.
Ask questions like:
- What specific feature or benefit do you value most?
- Is there anything we could do to exceed your expectations further?
- Would you be willing to refer us or provide a testimonial? (Optional for advocacy)
These insights not only strengthen retention strategies but also guide marketing and product teams in amplifying what works best.
Designing the Survey Flow and Timing
A well-timed and thoughtfully structured NPS survey can make the difference between collecting surface-level feedback and uncovering real churn risk insights.
Send Surveys After Meaningful Customer Moments
Timing is everything.
Send your NPS survey shortly after key interactions, for example, after a product milestone, renewal period, or customer support resolution.
This ensures feedback is fresh and context-specific.
For long-term users, schedule relational NPS surveys every few months to track sentiment trends over time.
Keep it Short But Insightful
A concise survey with one core NPS question and a few branching follow-ups is ideal.
This minimizes fatigue while still providing enough context to diagnose potential churn drivers.
Interpret Feedback in Context
Don’t just look at the score, but read between the lines.
For instance, a low NPS score combined with comments about reduced usage, pricing frustration, or unmet expectations signals an imminent churn risk.
Combine Survey Data With Behavioral Insights
Correlate NPS responses and identify churn risk using customer conversation data along with metrics like login frequency, feature adoption, or support tickets.
Customers showing declining engagement and negative sentiment should be flagged for immediate outreach.
By designing your NPS survey with timing, flow, and data integration in mind, you can move beyond measuring satisfaction and start predicting and preventing churn before it happens.
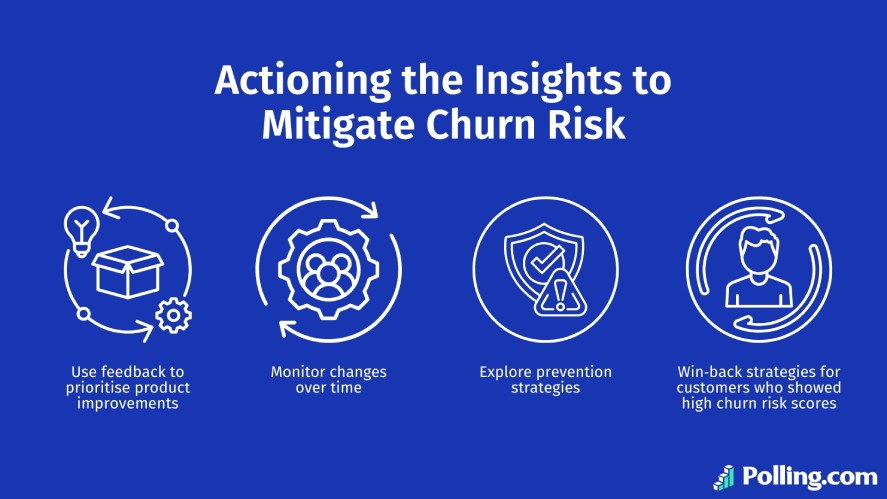
Actioning the Insights to Mitigate Churn Risk
Once you’ve gathered NPS data, the next step is turning those insights into action.
Start by closing the loop with detractors: respond quickly, identify pain points, and route them to customer success for direct support.
Timely engagement can prevent cancellations and rebuild trust.
Passives require a different approach. They’re not unhappy, but they’re at risk of switching if a better offer comes along.
Reach out to learn what’s missing, help them discover underused features, or make small improvements that could convert them into promoters.
At a broader level, look for patterns across feedback.
Repeated complaints about performance, pricing, or support point to systemic churn drivers, and leveraging Polling.com customer retention insights can help prioritize actionable interventions.
Feed these insights into your product, UX, and support roadmaps to reduce friction before it affects retention.
Finally, track changes over time, as declining NPS scores or recurring “almost churn” signals often reveal deeper issues.
Combine survey data with behavioral metrics like product usage or activity levels to spot at-risk customers early.
By acting on what your NPS survey reveals, you can shift from reactive churn management to proactive customer retention.
Conclusion
By asking the right follow-up questions in your NPS survey, you can uncover the early warning signs of churn and act before it’s too late.
Churn risk isn’t just a number; it’s a signal that something in the customer experience needs attention.
Whether it’s improving your product, refining support, or deepening engagement, each insight helps you protect retention and strengthen loyalty.
Start transforming your NPS survey into a churn-prevention engine with these templates, or use Polling.com survey platform to automate branching logic, track churn signals, and uncover retention opportunities with confidence.