Polling.com Reveals Voter Trends for the 2024 US Elections
Polling.com recently conducted a comprehensive survey to gather insights into voter behavior and expectations for the upcoming 2024 US elections.
This survey, integrated with Polling.com‘s robust analytical services, is accessible to all users at zero cost, providing valuable real political data for researchers, analysts, and the general public.
The survey results focus specifically on responses from individuals residing in the United States and are limited to English-speaking respondents.
Sample Size (n=198)
This survey had a total of 198 participants, offering a meaningful snapshot of voter sentiment.
Survey Overview
The survey ran for two months and ended on July 21, 2024, which included several key questions aimed at analyzing voter behavior and expectations. Here is a detailed look at each question, its purpose, and the implications of the responses.
1. How did your household vote in the 2020 General Election?
Question Format: Multiple Choice | 202 answers | ~1.7 seconds per response
| OPTION | RESPONSES | PERCENTAGE |
|---|---|---|
| Didn’t Vote | 71 | 35.1% |
| Trump | 56 | 27.7% |
| Biden | 75 | 37.1% |
Column Descriptions:
- OPTION: The voting choice made by respondents in the 2020 election.
- RESPONSES: The number of respondents who selected each option.
- PERCENTAGE: The percentage of total responses for each option.
Goal: This question aims to understand how households voted in the 2020 election. By comparing this data with current voting intentions, analysts can identify shifts in political allegiance and the impact of recent political developments.
Insights:
- A significant portion of respondents (35.1%) did not vote in 2020.
- Among those who voted, more respondents supported Biden (37.1%) compared to Trump (27.7%).
Impact: Analyzing past voting behavior helps measure changes in voter sentiment. It also helps predict voter turnout and potential candidate performance based on historical data.
2. How do you expect your household will vote in 2024?
Question Format: Multiple Choice | 171 answers | ~3.2 seconds per response
| OPTION | RESPONSES | PERCENTAGE |
|---|---|---|
| Not likely to vote | 66 | 38.6% |
| Trump | 45 | 26.3% |
| Biden | 60 | 35.1% |
Column Descriptions:
- OPTION: The expected voting choice in the 2024 election.
- RESPONSES: The number of respondents who selected each option.
- PERCENTAGE: The percentage of total responses for each option.
Goal: This question seeks to gauge how households intend to vote in the 2024 election. It highlights the level of voter engagement and the preferences for the upcoming election.
Insights:
- A notable portion of respondents (38.6%) are not likely to vote in 2024.
- The distribution of expected votes shows a close split between Biden (35.1%) and Trump (26.3%).
Impact: Understanding current voting intentions helps identify likely voter turnout and the strength of support for each candidate. This data is crucial for campaign strategies and resource allocation by political parties.
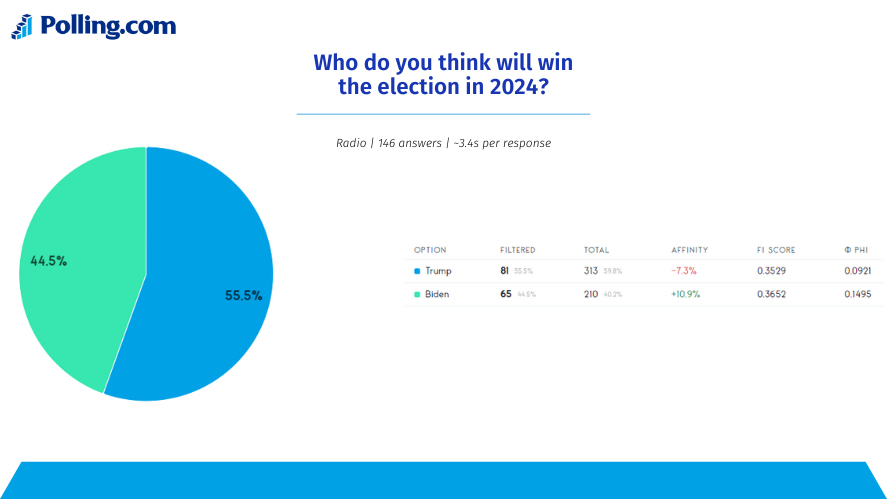
3. Who do you think will win the election in 2024?
Question Format: Multiple Choice | 146 answers | ~3.4 seconds per response
Graph Descriptions:
- OPTION: The candidate respondents believe will win the 2024 election.
- RESPONSES: The number of respondents who selected each option.
- PERCENTAGE: The percentage of total responses for each option.
Goal: This question captures the public’s perception of who will win the election, regardless of their personal voting intentions. It reflects general sentiment and confidence in the candidates’ chances of winning.
Insights:
- A majority of respondents (55.5%) believe Trump will win the 2024 election.
- A significant portion (44.5%) also believe Biden has a chance of winning.
Impact: Perceived likelihood of a candidate’s victory can influence voter behavior, potentially motivating higher turnout for the perceived underdog. It also provides insights into the effectiveness of each candidate’s campaign.
4. What is the primary reason you are planning to vote for your selected candidate in 2024?
Question Format: Open-Ended | 69 answers | ~33.3 seconds per response
Goal: This open-ended question aims to understand the motivations behind voters’ choices. It reveals the key issues and qualities that are driving voter support for each candidate.
Insights:
- Policy Alignment and Historical Voting Patterns:
- Some respondents indicated that their support for a candidate was based on a history of policy alignment. For instance, one respondent mentioned, “After voting Democrat for 21 years, never again,” highlighting a significant shift in political allegiance due to dissatisfaction with past party performance.
- Candidate Characteristics and Campaign Appeal:
- Personal attributes and the unique appeal of candidates were significant factors. One respondent humorously cited, “He’s the sigma Ohio skibidi rizzler. His campaign resonates with my beliefs,” indicating the importance of a candidate’s persona and campaign style in garnering support.
- Disillusionment and Protest Votes:
- A few responses reflected a sense of disillusionment with the political process or a protest vote mentality. For example, “I don’t vote and will never waste my time doing so,” underscores a broader sentiment of voter apathy and disengagement.
- Perceived Necessity and Social Influence:
- Some voters mentioned their intention to vote as a matter of perceived necessity or social influence, highlighting external factors impacting their decision-making process.
Impact: Analyzing the reasons behind voter preferences helps campaigns tailor their messages to address the most important issues for their supporters. It also provides a deeper understanding of the electorate’s priorities and concerns.
Respondent Details
- Country: 198 respondents from the United States
- Language: English
Graphical Insights
To provide a more in-depth analysis, the following graph visually compares the percentage of respondents planning to vote for Trump or Biden in the 2024 election, using data from Polling.com alongside other recent political polls. This comparison offers a clearer view of shifts in voter preferences and confidence across different samples.
Insights: Polling.com vs. Other Recently Conducted Political Polls
The polls listed below were used for comparison with Polling.com’s recent survey results, providing a more comprehensive look at current voter trends:
- CBS/YouGov (August 2024):
- Trump: 49%
- Biden: 50%
- Sample Size: 3,092 likely voters
- Margin of Error: ±2.1%
- Clarity Campaign Labs (August 2024):
- Trump: 47%
- Biden: 48%
- Sample Size: 995 likely voters
- Margin of Error: ±1.8%
- Morning Consult (July 2024):
- Trump: 46%
- Biden: 47%
- Sample Size: 11,538 registered voters
- Margin of Error: ±1%
Graph Presentation for Comparison with Recent Polls
The following graph provides a visual breakdown of these results, making it easier to interpret the percentage differences across the polls, including Polling.com’s data.
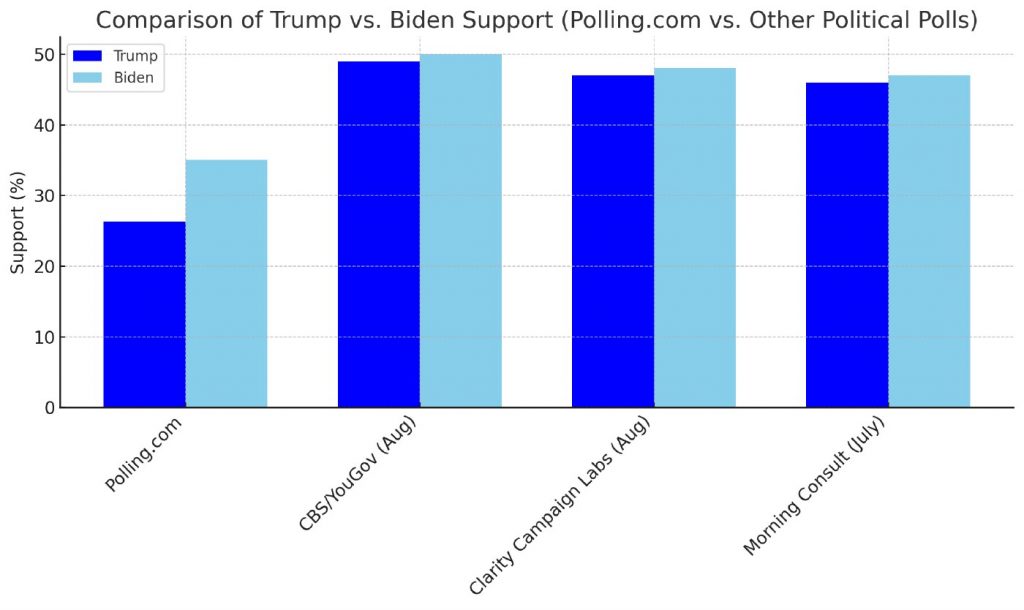
Here is the graph comparing Polling.com’s results with those from recent national polls. It highlights the percentage of respondents planning to vote for Trump and Biden across different sources. Polling.com’s results show unique trends that may reflect the specific demographic and sample size of its respondents compared to other national polls.
Conclusion
The survey we conducted here at Polling.com offers a comprehensive look at the current political landscape as we approach the 2024 elections. By examining past voting behavior, current voting intentions, perceptions of the election outcome, and the motivations behind voter choices, this survey provides valuable insights into the dynamics of the upcoming election.
Polling.com’s services, available at no cost, enable users to access detailed analyses and data, empowering them to make informed decisions and predictions. This survey not only helps in understanding the probable results of the election but also aids in refining campaign strategies and addressing the electorate’s needs more effectively.
As we move closer to the 2024 US elections, such data-driven insights will be crucial in shaping the political discourse and ensuring a more informed and engaged electorate.