Survey and Results: How to Analyze Survey Data (Step by Step)
Surveys are one of the most effective ways to collect feedback from customers, employees, and target audiences.
However, simply conducting a survey is not enough.
To gain real value, organizations must carefully analyze the survey and results data to uncover patterns, trends, and meaningful insights, and understand how to analyze survey results effectively.
Raw survey responses by themselves rarely provide clear answers.
Without proper analysis, large feedback datasets can be difficult to interpret. They may also lead to incorrect conclusions.
Breaking down survey results helps turn individual responses into structured insights. These insights support better decisions in marketing, product development, customer experience, and research.
Modern survey tools have made this process significantly easier.
Platforms like Polling.com streamline the entire workflow, from creating survey questions and distributing feedback forms to analyzing results through built-in dashboards and visualizations.
Compared with traditional survey platforms that require manual data exports and spreadsheets, Polling.com helps teams quickly move from data collection to actionable insights.
What Are Survey Results Data
Before analyzing survey results, it’s important to understand what survey data actually consists of and how it is structured.
Understanding Raw Survey Data
Raw survey data refers to the complete set of responses collected from participants after a survey is conducted.
Each individual response contributes to a dataset that represents the opinions, behaviors, or experiences of the surveyed group.
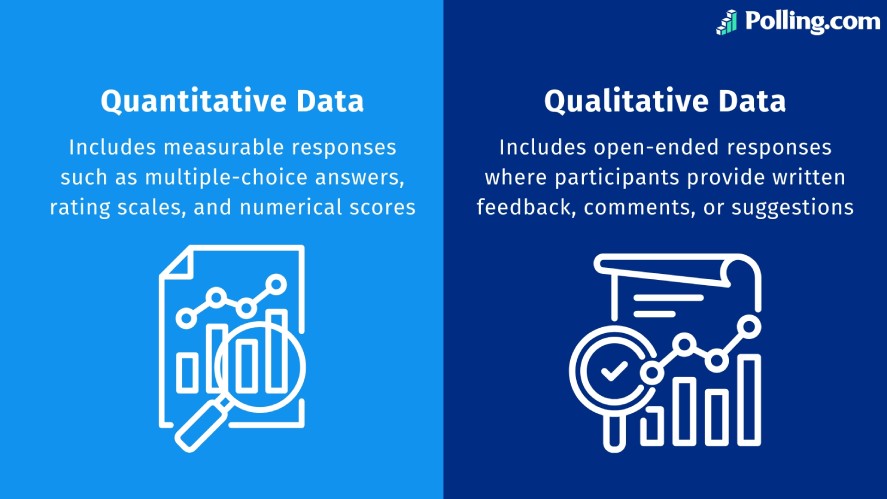
Survey datasets typically contain two main types of data:
- Quantitative Data: includes measurable responses such as multiple-choice answers, rating scales, and numerical scores. Survey questions examples include satisfaction ratings, ranking questions, or Net Promoter Score responses.
- Qualitative Data: includes open-ended responses where participants provide written feedback, comments, or suggestions. This type of data often reveals deeper insights into why respondents answered in a certain way.
Both types of data are valuable. Quantitative responses provide measurable trends, while qualitative responses offer context and explanations behind the numbers.
Why Survey and Results Need to Be Broken Down
Collecting survey responses is an important first step. However, raw data alone does not produce useful insights.
Large sets of responses need to be organized and analyzed. This helps reveal patterns that are not easy to see at first.
Breaking down survey results helps identify trends across respondent groups. It also allows comparison between different segments and highlights recurring themes in comments.
For example, analysis may show that younger customers rate a product differently than older users. It may also reveal a common complaint that appears often in open-ended responses.
By turning raw responses into structured findings, businesses and researchers can turn feedback into actionable insights.
This process helps organizations improve products, refine marketing strategies, and make data-driven decisions based on real user input.
Common Types of Survey and Results Data
Survey results usually include several types of data that help organizations understand both measurable trends and deeper user feedback.
Recognizing these data types makes it easier to choose the right analysis methods and extract meaningful insights.
Quantitative Survey Data
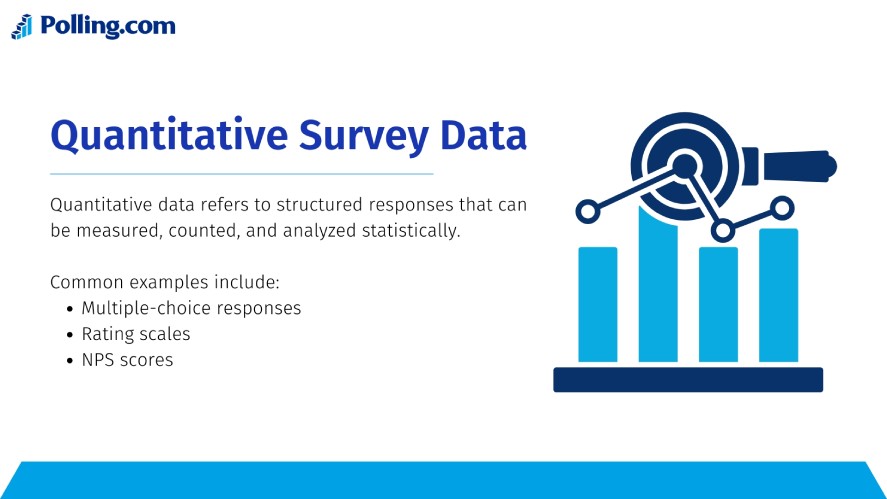
Quantitative data refers to structured responses that can be measured, counted, and analyzed statistically.
This type of data is often the easiest to summarize because it can be converted into numbers and percentages.
Common examples include multiple-choice responses, where participants select predefined answers from a list.
These questions help researchers quickly identify patterns across large groups of respondents.
Rating scales are another common format.
It allows respondents to rate experiences on scales such as 1–5 or 1–10. These scales are widely used in satisfaction surveys and customer feedback forms.
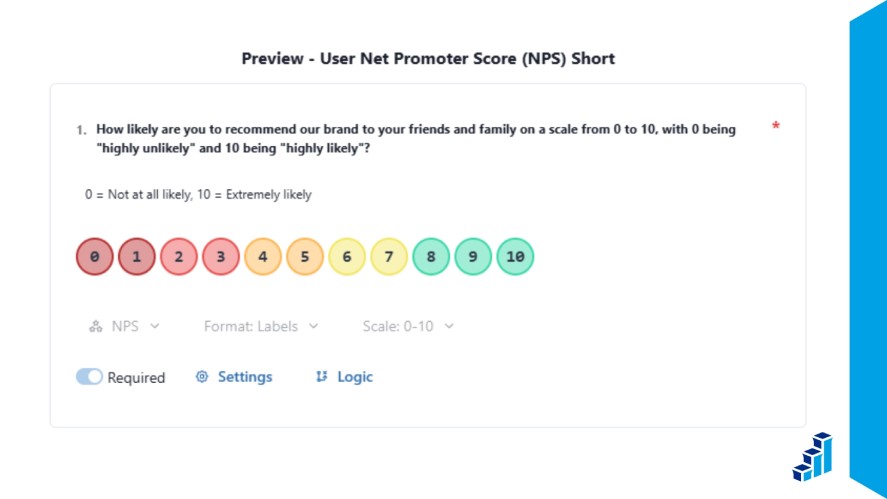
Net Promoter Score (NPS) is also a form of quantitative survey data.
It measures customer loyalty by asking respondents how likely they are to recommend a product or service to others.
NPS results are commonly used as a key performance metric in customer experience analysis.
Qualitative Survey Data
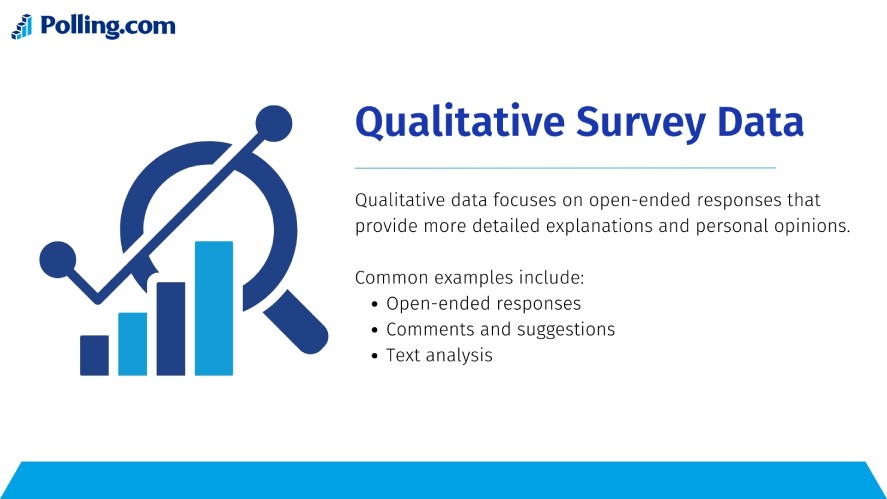
Qualitative data focuses on open-ended responses that provide more detailed explanations and personal opinions.
Instead of selecting predefined answers, respondents write their thoughts in their own words.
This includes open-ended survey responses, where participants explain their experiences or provide suggestions.
These answers often reveal insights that structured questions may miss.
Respondents may also provide comments and suggestions about products, services, or experiences.
These responses can highlight specific issues, feature requests, or opportunities for improvement.
To analyze large amounts of qualitative feedback, organizations often use text analysis techniques such as keyword identification, sentiment analysis, or categorization of common themes.
Behavioral and Demographic Data
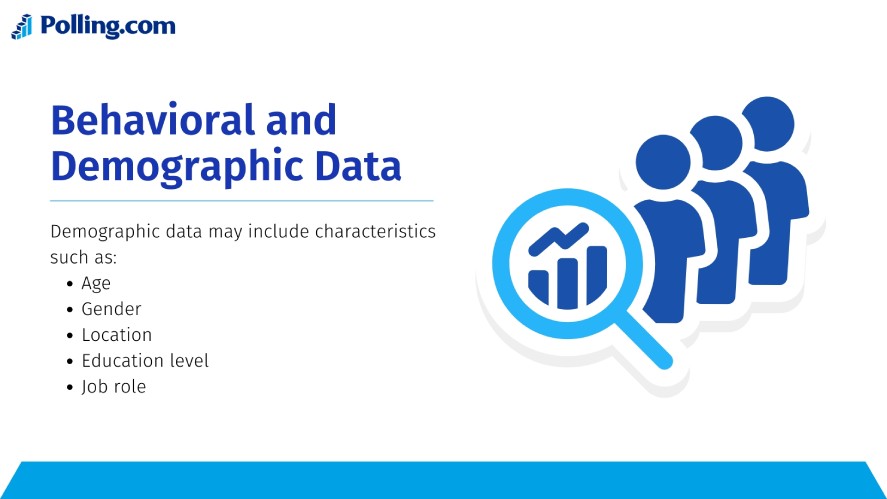
In addition to survey answers, many surveys also collect contextual data about respondents. This information helps researchers segment responses and identify differences between groups.
Demographic data may include characteristics such as age, gender, location, education level, or job role.
These variables help analysts understand how opinions vary across different segments of the population.
Behavioral data focuses on how respondents interact with a product or service.
This can include purchase history, usage frequency, customer lifecycle stage, or other behavioral patterns.
By combining survey responses with demographic and behavioral data, analysts can gain deeper insights into why different groups respond the way they do.
Methods to Break Down Survey Results Data
Once survey responses are collected, the next step is to organize and analyze the data in ways that reveal patterns and meaningful insights and demonstrate how to do analysis of survey data effectively.
Several common analysis methods help researchers and businesses understand how different groups respond and how opinions change over time.
Data Segmentation
Data segmentation involves dividing survey respondents into smaller groups based on shared characteristics.
This method lets analysts compare how different audience segments respond to the same questions.
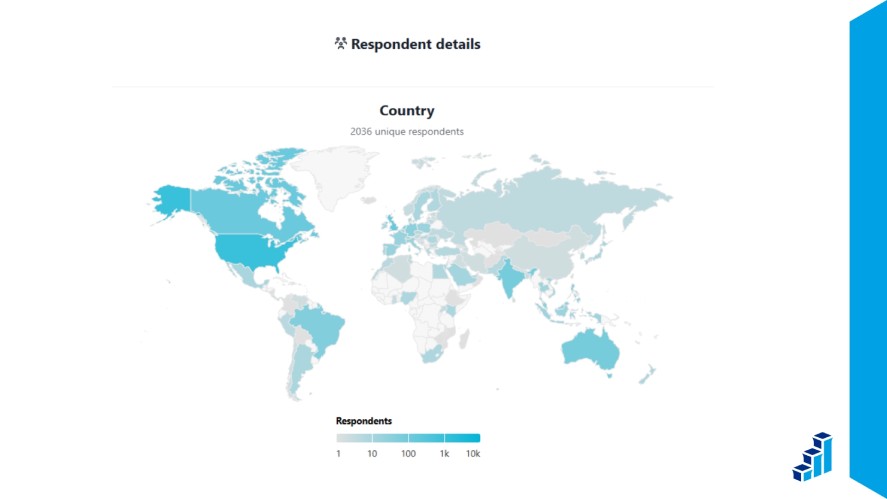
One common approach is grouping respondents by demographics, such as age, gender, location, or job role.
For example, a company may find that younger customers rate a product differently than older customers.
Another method is behavioral segmentation. It groups respondents by purchasing habits, product usage, or engagement levels.
Behavior-based segmentation helps organizations understand how different users experience a product or service.
Cross-Tabulation Analysis
Cross-tabulation, often called cross-tab analysis, compares responses across two or more variables.
This method helps identify relationships between different survey questions or respondent characteristics.
For example, analysts may compare customer satisfaction scores by age group. They may also examine how product satisfaction differs between new and long-term customers.
Cross-tabulation allows researchers to identify patterns that may not be visible when looking at overall averages.
This approach is especially useful when analyzing large datasets because it reveals how different segments respond to the same questions.
Trend Analysis
Trend analysis focuses on tracking survey results over time. Instead of analyzing responses from a single survey, this method compares results across multiple survey periods.
By monitoring trends, organizations can see whether customer satisfaction is improving, declining, or remaining stable.
For example, a monthly employee engagement survey may show gradual improvements in team morale. It may also highlight new concerns that need attention.
Trend analysis helps businesses find long-term patterns. It also helps measure the impact of changes such as product updates, policy changes, or marketing campaigns.
Score-Based Analysis
Score-based analysis focuses on interpreting numerical ratings and survey scoring systems.
Many surveys use rating scales, such as satisfaction scores or likelihood-to-recommend questions. These responses can be analyzed with summary statistics.
A common example is Net Promoter Score (NPS) analysis. This method groups respondents into promoters, passives, and detractors based on their ratings.
This scoring system provides a simple way to measure customer loyalty and overall sentiment.
By analyzing rating scores, organizations can quickly measure performance, track improvements, and identify areas where customer experiences need attention.
Visualizing Survey Results for Better Insights
After analyzing survey data, presenting the results clearly is just as important as the survey data analysis itself.
Data visualization helps transform complex datasets into simple visuals that make patterns, comparisons, and trends easier to understand and demonstrate how to present survey results clearly.
Charts and Graphs
Charts and graphs are some of the most effective ways to present survey results. They allow audiences to quickly grasp key findings without having to review large tables of numbers.
Bar charts are commonly used to compare responses across different answer choices or respondent groups.
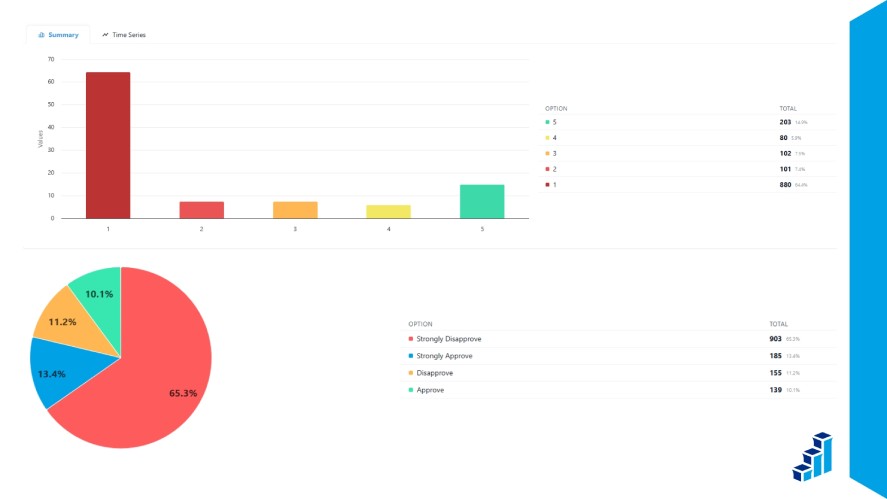
For example, they can show how many participants selected each option in a multiple-choice question.
Pie charts are useful for displaying proportions within a dataset.
They help illustrate how responses are distributed across categories, such as the percentage of respondents who chose each option.
Line charts can be used for visualizing trends over time.
When surveys are conducted regularly, line charts can highlight changes in satisfaction scores, engagement levels, or other key metrics.
Dashboards and Data Visualization Tools
Survey dashboards provide a centralized way to organize and explore survey results.
Instead of creating charts manually in spreadsheets, dashboards automatically turn survey responses into visual reports.
These tools simplify survey results presentation. They show key metrics, response distributions, and trends in a clear format.
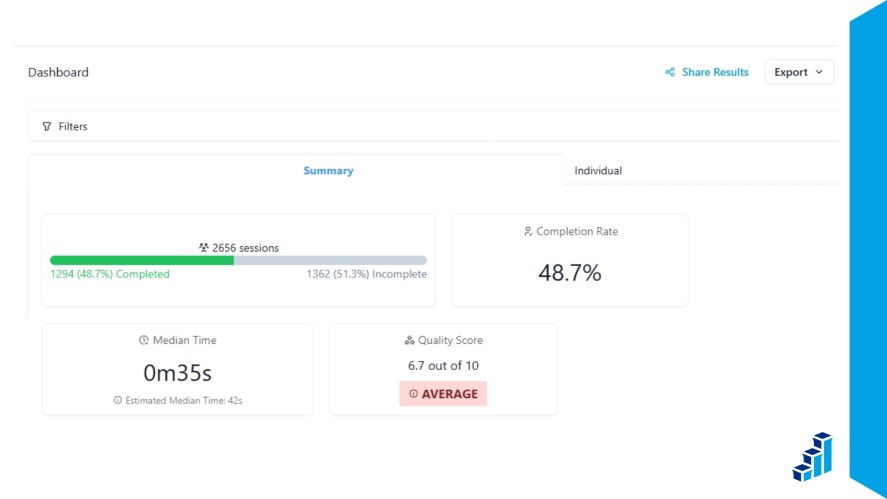
Analysts can quickly filter results, compare segments, and identify patterns without manual calculations.
Many modern survey platforms also include real-time visualization features. Teams can monitor survey responses as they arrive.
This helps teams track participation levels, spot trends early, and adjust strategies based on live feedback.
Best Tools to Analyze Survey and Results Data
Choosing the right survey tool can significantly improve how efficiently you collect, analyze, and present survey results.
Polling.com
Polling.com helps simplify the entire survey lifecycle, from creating questions to analyzing responses.
The platform lets users quickly build surveys, learn how to write survey questions, share them with target audiences, and track participation in real time.
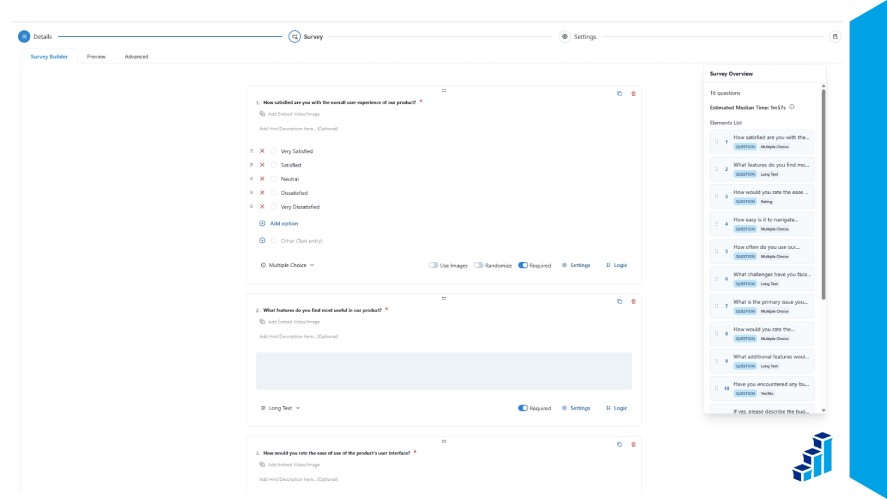
It also includes built-in analytics dashboards. These dashboards organize responses into charts, summaries, and performance metrics.
One key advantage of Polling.com is its real-time result breakdown and segmentation. Users can filter survey results by respondent groups, track trends as responses arrive, and generate insights faster.
Compared with many traditional survey tools, Polling.com offers a more streamlined and flexible workflow. Teams can move from data collection to actionable insights with less manual effort.
Other Survey Tools
Several other survey platforms are commonly used for collecting and analyzing survey data.
SurveyMonkey is one of the most widely known survey tools and offers a range of templates, reporting features, and integrations for business surveys and research projects.
Google Forms provides a simple and free way to create surveys and collect responses. While it is easy to use, its analytics features are more basic and often require exporting data to spreadsheets for deeper analysis.
Typeform focuses on interactive survey design with conversational-style question flows. Its visually appealing interface can help increase engagement, though advanced analytics often require additional integrations.
Each tool offers different strengths depending on the complexity of your surveys, the level of analysis required, and the scale of your data collection.
Common Mistakes When Breaking Down Survey Results
Analyzing survey results can provide valuable insights. However, certain mistakes can lead to inaccurate conclusions or missed opportunities.
Here are the common mistakes to avoid when breaking down survey results.
Ignoring Small Data Segments
One common mistake is focusing only on overall averages while ignoring smaller respondent groups.
Even if a segment represents a small portion of the dataset, it may reveal important patterns or issues.
For example, a small group of customers might report significantly lower satisfaction than the majority.
If analysts overlook this segment, they may miss early warning signs of product or service problems.
Carefully reviewing smaller data segments can uncover insights that might otherwise remain hidden in aggregated results.
Overlooking Qualitative Feedback
Another frequent mistake is prioritizing numerical results while ignoring open-ended responses.
While quantitative data provides clear metrics, qualitative feedback often explains why respondents answered the way they did.
Open-ended comments, suggestions, and detailed feedback can highlight specific issues, feature requests, or customer frustrations.
These insights often provide the context needed to interpret survey scores accurately.
Combining qualitative feedback with numerical data creates a more complete understanding of survey results.
Misinterpreting Statistical Results
Survey analysis can sometimes lead to incorrect conclusions when statistical relationships are misunderstood.
One common issue is confusing correlation with causation.
For example, a survey might show that customers who use a certain feature report higher satisfaction.
However, this does not necessarily mean the feature caused the higher satisfaction, as other factors may be involved.
Careful data analysis in surveys and additional context are often needed before drawing strong conclusions from survey data.
Understanding the limits of statistical relationships helps prevent misleading interpretations.
Best Practices for Analyzing Survey and Results
Applying structured analysis methods helps ensure that survey data leads to clear insights and meaningful business decisions.
The following best practices can help teams analyze survey and results data more effectively.
Start With Clear Objectives
Before analyzing survey data, it is important to define the purpose of the survey and the specific insights of the survey topics you want to obtain.
Clear objectives help guide the analysis process and prevent teams from getting lost in large datasets.
For example, a survey may aim to measure customer satisfaction, identify product improvement opportunities, or understand employee engagement.
When the goals are clearly defined, analysts can focus on the most relevant polling questions, metrics, and respondent segments.
Focus on Key Metrics
Not every piece of survey data carries equal importance. Identifying a few core metrics makes it easier to evaluate performance and track progress over time.
Common survey metrics include Net Promoter Score (NPS), customer satisfaction ratings, survey response rates, and survey completion rates.
These metrics help measure engagement, loyalty, and the overall quality of the survey process. They also help teams compare results with common survey benchmarks.
By prioritizing key metrics, organizations can monitor trends more effectively and avoid being overwhelmed by unnecessary data points.
Combine Quantitative and Qualitative Analysis
The most valuable insights often come from combining numerical data with written feedback.
Quantitative responses show measurable trends. Qualitative comments explain the reasons behind those trends.
For example, satisfaction scores may show that users are unhappy with a product feature. Open-ended responses can reveal the exact problems customers experience.
Using both types of data together gives a clearer understanding of survey results. It also supports better decision-making.
Conclusion
Breaking down survey and results data transforms raw responses into meaningful insights.
When organizations properly segment, analyze, and visualize survey data, they gain a clearer understanding of customer needs, employee feedback, and overall performance.
Modern survey platforms also simplify this process.
Tools like Polling.com streamline survey creation, distribution, and survey results analysis through built-in dashboards and real-time reporting features.
By using the right tools and analysis techniques, organizations can turn survey data into actionable insights that drive continuous improvement.