Validate Survey Data Using R-Squared: A Step-by-Step Explanation
Surveys are like gold for businesses, researchers, and policymakers, giving you a peek into what people think, whether it’s customers rating a new gadget or voters picking a candidate.
But with online tools making conducting a survey a breeze, it’s easy to end up with data that’s more noise than signal.
That’s where validate survey comes in, using stats to check if your results actually mean something.
One perfect tool for this? R-Squared, a number that shows how well your survey explains what’s going on.
This article breaks down what is R Squared stats, shows you how it helps validate survey results, and gets you ready to make smarter decisions with polls and surveys.
What It Really Means to Validate a Survey
When you validate survey data, you’re making sure it’s not just a bunch of random answers but a true reflection of what respondents think.
Let’s dig into what validation is and why it’s a must for survey analytics.
Defining Survey Validation
So, what does it mean to validate survey results? It’s about checking a few key things to make sure your survey is on point.
First, content validity: are your questions hitting the mark? If you’re asking about customer satisfaction, do they really measure how happy people are with your product?
Second, construct validity: do the results match what you’d expect? For example, if your survey type shows happy customers, are they also buying more?
Last, statistical validity: are the patterns in your data solid? That’s where R-Squared stats come in, helping you see if your survey’s model holds up.
Together, these checks improve survey validity and ensure your different survey types, from quick polls to in-depth forms, give you data you can trust.
Why Validation Matters for Survey Reliability
Mess up questionnaire validation, and your survey’s no better than a coin flip.
Bad data can lead to bad moves, like a company thinking customers love a feature when they hate it, wasting cash on a flop. Or worse, it can make bosses or clients lose faith in your work.
That’s why you need tricks like regression analysis, factor analysis, or R-Squared calculation to back up your validate survey efforts.
R-Squared, a star in what is survey analytics, tells you how much of your data makes sense, not just noise.
For any types of survey, from employee feedback to market research, validation keeps your insights sharp and your decisions smart.
Breaking Down R-Squared: A Simple Guide
If you’re wondering how to validate survey data with stats, R-Squared is your go-to. But what is it, and how does it work?
What Is R-Squared?
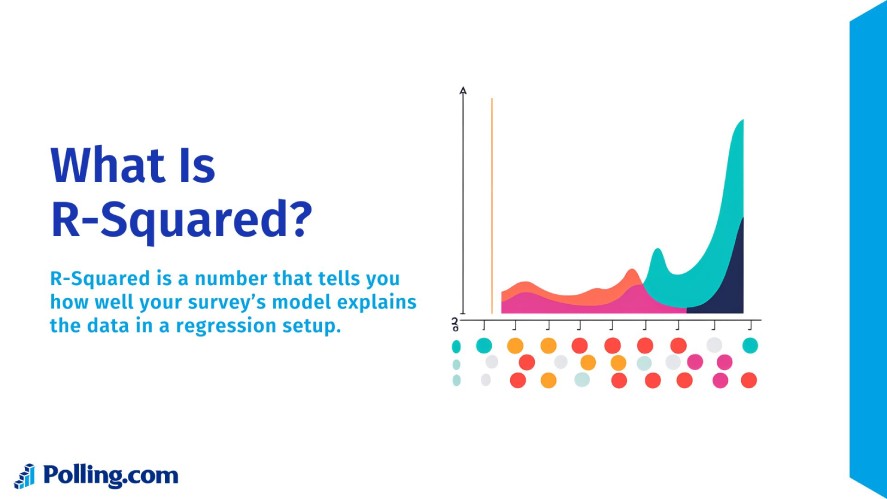
R-Squared, or the coefficient of determination, is a number that tells you how well your survey’s model explains the data in a regression setup.
In plain English, it shows how much of the ups and downs in one thing, like customer satisfaction, can be explained by other factors, like price or service speed.
For example, say you run a survey type on employee happiness and use variables like work hours, pay, and management style to predict it.
R-Squared reveals how much those factors drive satisfaction scores, giving you a clear read on your model’s strength.
It’s a core part of r squared statistics, helping you validate survey results by showing what’s real and what’s just noise.
The R-Squared Scale: 0 to 1
R-Squared runs from 0 to 1, and it’s pretty straightforward.
A score of 0.0 means your model explains none of the changes in your data, like trying to predict survey responses with irrelevant factors. A 1.0 means it explains everything perfectly, which is rare in real life.
In polls and surveys, especially in social sciences, an r2 score between 0.3 and 0.6 is often decent. It means 30% to 60% of the variation is explained.
For instance, if your employee survey hits an R-Squared of 0.4, you’re catching a good chunk of what drives happiness, but there’s still room for other factors.
Knowing how to interpret r squared like this helps you gauge if your different forms of surveys are on the right track.
How R-Squared Helps Validate Survey Results
Now that you know what is R-Squared, let’s see how it helps validate survey data, making sure your survey analytics are solid and your insights hold up.
Measuring Explanatory Power
R-Squared is a big deal for checking if your survey questions actually measure what you think they do.
Picture a customer survey where you’re predicting “intent to recommend” based on satisfaction, wait time, and support quality.
A high r2 score, say 0.5, means those factors do a solid job explaining why some customers recommend you and others don’t.
This r squared interpretation tells you your questions are relevant, helping validate survey design by showing your inputs align with the outcome.
If the score’s low, like 0.1, your questions might miss the mark, pushing you to rethink your survey type.
Checking for Consistency and Relevance
Consistency is key in surveys, and R-Squared helps you test survey accuracy and see if your results hold up across groups or time.
For example, if you split your survey data by age or region and the R-Squared stays steady, say around 0.4, your different survey types are likely reliable, a process called cross-validation.
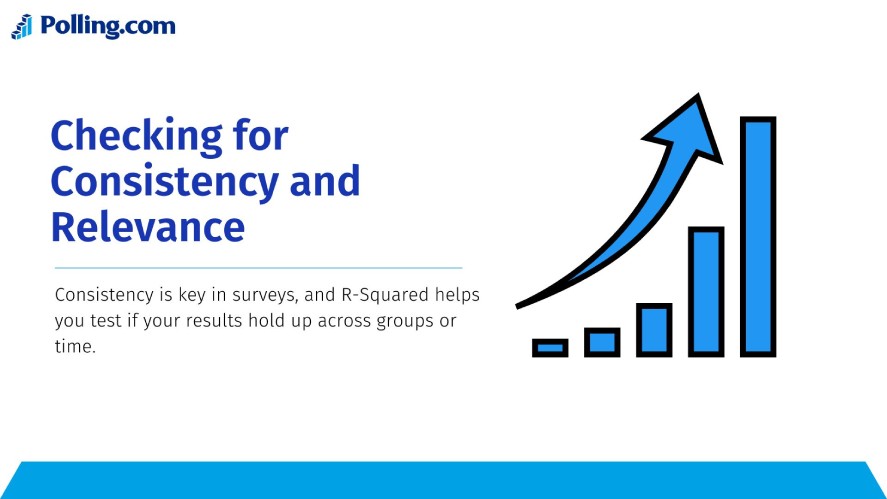
But if it swings wildly, your survey might be picking up random noise instead of real patterns.
This r squared explained check ensures your questions are relevant, letting you trust your data whether you’re conducting a survey for employees or customers.
R-Squared for Predictive Surveys
Lots of modern surveys aren’t just about describing what’s happening, they’re about predicting stuff, like who’s likely to quit a job or stop buying your product.
R-Squared steps up by showing how well your survey’s inputs, like satisfaction or price sensitivity, predict those outcomes.
Say your survey analytics on customer churn hits an R-Squared of 0.6, it means your factors, like support quality, are strong predictors, boosting confidence in your model.
This significance of r square makes it a must for predictive types of survey, helping you validate survey data that drives big decisions.
Use Cases: Real Examples of Validate Surveys with R-Squared
Seeing R-Squared in action shows how it helps validate survey data, so let’s check out some real-world cases where it makes a difference.
Customer Feedback Loop in SaaS
Picture a SaaS company running a survey type to boost its Net Promoter Score (NPS), asking 1,000 users about onboarding ease, support chats, and response times.
They use regression to see how these factors predict NPS, and R-Squared comes in at 0.55. This means over half the variation in NPS ties to those drivers.
This r-squared interpretation confirms the survey’s questions are on point, justifying a big spend on smoother onboarding.
By using survey analytics to validate survey design, the company knows its data is solid, paving the way for smarter upgrades.
Political Polling and Voter Behavior
Now imagine a political survey trying to predict voting intention based on education, income, and party ties, sent to 2,000 respondents.
The R-Squared hits 0.4, showing these factors explain a decent chunk of who’s voting for whom, but not everything.
This r squared value meaning validates the survey’s design, it’s catching real patterns, yet also hints at outside influences, like news or events, shaping votes.
For polls and surveys in politics, this moderate r2 score gives confidence in the data while keeping expectations realistic.
Employee Engagement Surveys
Think of a company surveying 500 workers on engagement, asking about communication, leadership, and recognition.
They run a regression to see if these explain overall engagement scores, landing an R-Squared of 0.45.
That’s a green light that their questions are relevant, helping validate survey results by showing these factors drive nearly half the engagement vibe.
This r squared explained insight pushes the company to focus on better team huddles, knowing their survey type is dialed in for real impact.
The Limits of R-Squared in Survey Validation
R-Squared is a handy tool to validate survey data, but it’s not a magic wand. Knowing its limits keeps your survey analytics honest.
R-Squared Doesn’t Prove Causation
A solid R-Squared score shows correlation, not causation, so don’t jump to conclusions.
For example, say your survey type on customer satisfaction finds a high r2 score linking satisfaction to store location. That doesn’t mean location causes happiness, maybe wealthier areas just have happier customers.
This r squared value meaning is key: it tells you factors move together, not that one drives the other.
When you validate survey results, pair R-Squared with common sense to avoid mistaking correlation for cause.
Overfitting and Misleading Models
Throw in too many factors, and your R-Squared can look great, say 0.8, but mean nothing useful, a trap called overfitting.
For instance, if you predict survey responses with 20 variables, your model might fit the data too closely, catching random noise instead of real trends.
That’s where Adjusted R-Squared shines, tweaking the score to account for extra variables, giving a truer read on your model’s worth.
When conducting a survey with multiple predictors, lean on Adjusted R-Squared to keep your r squared interpretation grounded and avoid flashy but flimsy results.
Best Practices for Using R-Squared in Survey Analysis
To make R-Squared work for validate survey efforts, follow these survey design best practices to keep your survey analytics sharp and your insights clear.
Use in Context to Validate Survey
Don’t just stare at R-Squared numbers, they’re only part of the story.
A decent r2 score, like 0.5, looks nice, but check residual plots to see if your model’s off, or p-values to confirm your factors matter.
Also, weigh practical significance, does a 0.4 R-Squared in a customer survey actually change your strategy?
Blend r squared statistics with real-world know-how, like knowing your industry’s norms, to make sure your different survey types deliver insights that click.
Assure Assumptions Are Met
R-Squared only works if your data plays by the rules. Check that your variables have a straight-line relationship, not a wonky curve, or your r2 score will mislead.
Also, watch for multicollinearity, when predictors like price and quality overlap too much, skewing results.
For example, in a survey type on employee retention, ensure factors like pay and benefits aren’t too intertwined.
Running these checks before how to find r 2 keeps your validate survey efforts solid and your models trustworthy.
Visualize and Communicate Clearly
Make your R-Squared findings pop for non-techy folks, like bosses or clients.
Scatter plots with regression lines can show how well your survey data fits, like plotting satisfaction against wait time to highlight 0.5 r-squared values.
These visuals make r squared explained easy to grasp, turning stats into stories.
Whether you’re sharing results from polls and surveys, clear charts help everyone see why your validate survey work matters, driving better decisions without the jargon.
Complementary Methods to Support Validation
R-Squared is awesome for validate survey work, but it’s not the only trick in the book. Other stats tools can enhance your survey analytics too.
To round out validation, try Cronbach’s Alpha, which checks if your survey questions hang together, like ensuring all engagement questions measure the same vibe.
Factor Analysis digs into whether your different survey types tap into the right concepts, say confirming that leadership and trust questions both hit “culture”.
ANOVA and T-Tests are great for spotting differences, like if satisfaction varies by age group.
Pairing these with R2 calculation gives you a full picture, ensuring your types of survey are rock-solid from every angle.
R-Squared as a Smart Way to Validate Survey Data
R-Squared is a practical, stats-savvy way to validate survey data. It shows you how much your survey’s factors explain what respondents are saying, whether it’s customer love, voter picks, or employee vibes.
But don’t lean on it too hard, a shiny r2 score isn’t the whole story, mix it with other tools for a bulletproof check.
For polls and surveys aiming to drive big calls, how to interpret r squared keeps your data honest and your insights sharp.
Want to dig deeper? Fire up survey analytics with these methods to build trust in your results, because solid data is what makes your different forms of surveys really sing.
Ready to build surveys that are easy to analyze and validate? Try designing your next data-driven survey with Polling.com — built for clarity, speed, and better insights.
