100 Statistical Survey Questions Across All Niches
Looking for inspiration for your next stats project or research study? The secret to uncovering meaningful data starts with asking the right statistical survey questions.
Whether you’re studying student habits, consumer trends, or community opinions, every great survey begins with questions that spark curiosity and reveal real insights.
That’s why so many researchers and students turn to Polling.com. It’s packed with ready-to-use statistical survey examples, creative topic ideas, and smart tools that make designing your survey effortless.
From branching logic to exportable data reports, Polling.com turns your ideas into powerful, insight-driven results.
In this guide, we’ll dive into:
- Why well-designed statistical survey questions matter
- Best practices for question design
- A comprehensive list of 100 statistical survey question examples across major industries
- How to use them effectively within Polling.com
- Tips to analyze your data meaningfully
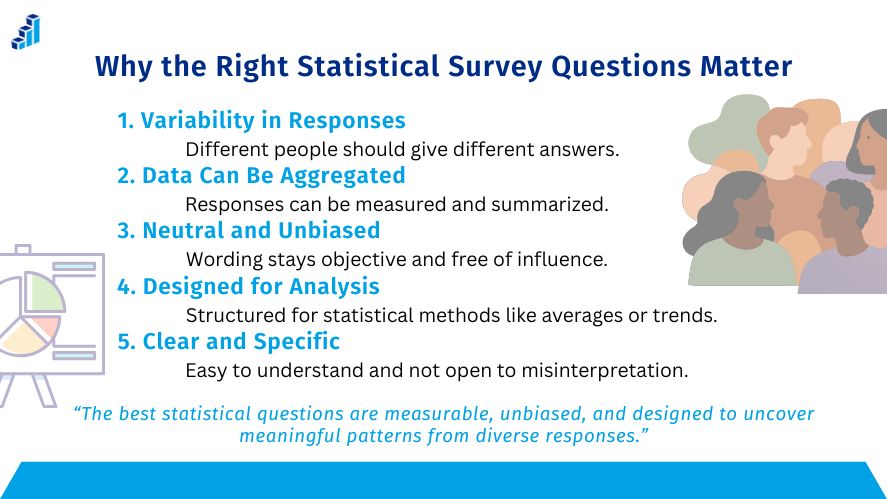
Why the Right Statistical Survey Questions Matter
What is a Statistical Question?
A statistical question is one that anticipates variability in responses and is answered by collecting and analyzing data. It differs from factual questions (e.g., “What is your age?”) in that it requires gathering data from multiple sources or people and then summarizing or analyzing it.
Example of statistical survey question:
“How many hours do college students sleep on average during exam weeks?”
This question assumes variability in sleep patterns and requires data from a group to answer.
According to the National Center for Education Statistics, the concept of variability is at the core of sound statistical practice and informs how we interpret results at scale.
What makes a question statistical?
- It accounts for variability
- It requires data collection
- It allows for data aggregation and analysis
Why Good Question Design is Critical
Poorly worded or biased questions can undermine your results. Whether you’re asking quantitative survey questions (like “How many minutes do you exercise daily?”) or open-ended ones, the way you ask directly impacts:
- Data quality
- Reliability of insights
- Elimination of bias
- Respondent clarity and completion rates
The right statistical survey questions lead to statistical questions that can be analyzed using averages, medians, correlations, and more, which is exactly what Polling.com is designed to support. With features tailored for niche research, its robust tools help ensure you ask the right questions and extract the best insights.
Want to ensure you’re avoiding common pitfalls in your survey? Read our article on mistakes to avoid in survey design for real-world examples and fixes.
Best Practices for Writing Statistical Survey Questions
Define Your Objective and Target Population
Before writing a single question, be clear about:
- What you want to measure
- Who you’re measuring it from
This alignment ensures that your questions are relevant, your data is representative, and your survey stays on track.
Example: A health startup targeting young adults may ask, “How many times a week do you prepare meals at home?” rather than asking about general household habits.
Choose the Right Question Type
Different data needs require different question types. Understanding the types of survey questions helps ensure useful results.
- Numerical (Quantitative): “How many hours do you study per week?”
- Categorical: “Which of the following best describes your job role?”
- Rating Scale: “On a scale of 1–10, how satisfied are you with our service?”
You can learn more about this in our dedicated guide to types of survey question formats.
Choose based on whether your data needs are quantitative or qualitative.
Avoid Biased, Ambiguous, or Leading Wording
A good statistical survey question must be:
- Neutral: Avoid leading phrasing like “Don’t you agree that…”
- Clear: Use simple language
- Specific: Eliminate vagueness
❌ Bad: “Don’t you think our product is the best?”
✅ Good: “How would you rate your satisfaction with our product on a scale of 1–10?”
Mix Question Types and Keep Respondent Fatigue in Mind
Avoid boring or exhausting your audience:
- Combine multiple-choice, sliders, numeric inputs, and Likert scales
- Keep it short and intuitive
- Use visual breaks and progress indicators
SurveyMonkey and Pew Research both highlight that question variety improves response quality, so mixing formats is both a user-friendly and statistically smart approach.
Plan for Analysis from the Start
Design with the end in mind:
- Will you calculate means, medians, or standard deviation?
- Will you run group comparisons or correlations?
Crafting questions with your analysis goals helps ensure clean, structured data — making your statistical survey truly actionable.
100 Statistical Survey Questions for Every Niche
Here’s your ultimate library of statistical survey question examples, organized by niche. These are ready-to-use, customizable, and built to uncover actionable insights.
Marketing & Consumer Behavior
- How much (in USD) did you spend online in the last 30 days?
- On average, how many products do you research before making a purchase?
- Which of these platforms do you use to discover new products? (Instagram, TikTok, Google, Other)
- What percentage of your purchases are made via mobile?
- How often do you check product reviews before buying?
- On average, how much time do you spend comparing prices?
- What’s your preferred device for online shopping?
- How likely are you to recommend our product? (1–10 scale)
- Which of these factors influence your purchase decision most?
- How many brands do you follow on social media?
- What type of content prompts you to make a purchase?
- What is your monthly online shopping frequency?
Employee & Workplace
13–24: [see original post above for complete list per section]
(This continues through Health & Wellness, Education, Technology & Internet, Social & Lifestyle, Finance & Spending, Travel & Transportation, Environment & Sustainability)
How to Use These Questions in Polling.com
Using these statistical survey question examples in Polling.com is effortless:
- Import questions into the free survey builder
- Use drag-and-drop to organize by section or topic
- Apply branching logic to personalize follow-up questions
- Export results for analysis (Excel, CSV, SPSS)
- Customize language, scale values, or format for your niche
Polling.com’s interface is built for speed and flexibility, and you can also save templates or clone surveys to reuse best performers. If you’re curious how others are using it, explore some polling.com survey topics our community frequently polls on.
Tips for Analyzing Your Survey Data
Once you collect responses, here’s how to make the most of them:
Use Basic Statistical Measures
- Mean (average responses)
- Median (middle value)
- Mode (most frequent)
- Standard Deviation (spread of responses)
Explore Patterns
- Use correlation analysis to see relationships
- Segment results by demographics or response groups
- Test significance (T-tests, Chi-square) if applicable
Data Hygiene
- Clean for missing or duplicate entries
- Ensure your sample represents your target population
- Watch for outliers that skew results
If you’re just getting started with analysis, the Khan Academy guide on statistics is a beginner-friendly reference that covers these methods in depth.
Conclusion
Asking the right statistical survey questions is more than a technical skill, it’s a strategic advantage. Whether you’re conducting market research, gathering employee feedback, or analyzing social trends, a thoughtful question can unlock impactful decisions.
The 100-question bank above serves as a powerful launchpad. Customize them by niche, audience, and purpose and let Polling.com transform your questions into real insights.